Department of Human Services (DHS)

Data Dashboards and Reports

DHS is committed to data-driven decision making that supports Pennsylvanians who are eligible for our programs and services achieve good health, sustainable stability, and success for themselves and their families.

Illustration of different types of data.

Projected Medicaid & SNAP Losses Due to Federal Changes

The federal budget reconciliation bill passed by Congress in July 2025 will have dangerous consequences for programs like Medicaid and SNAP and the people they serve. 

Below are projections of how many Pennsylvanians could lose Medicaid and SNAP as provisions in the law take effect. Learn more about Medicaid, SNAP, and other programs overseen by DHS throughout this page.

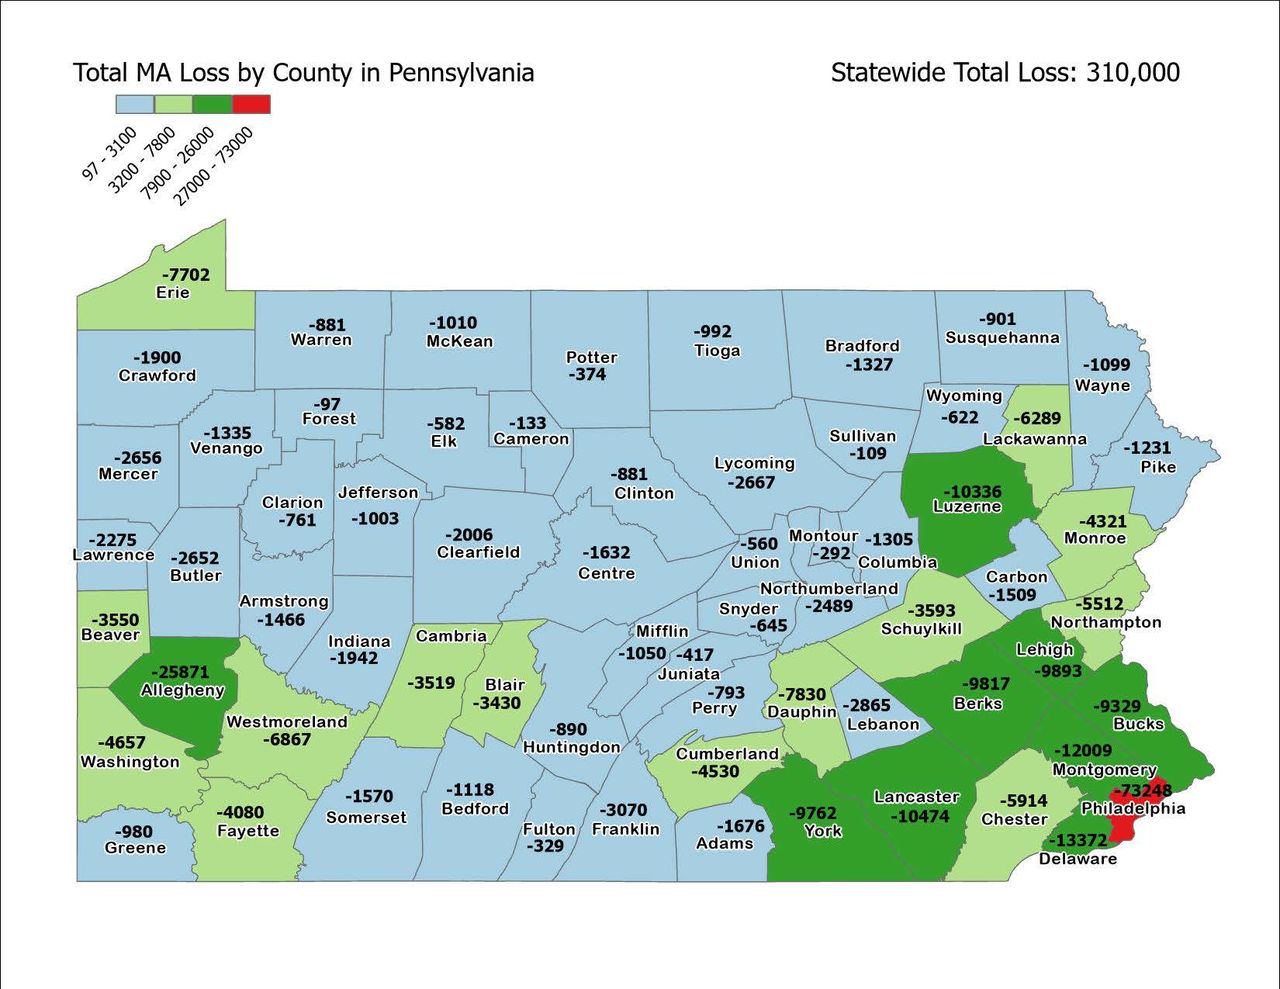
Projected Pennsylvanians who will Lose Medicaid Due to Federal Changes by:

Data as of July 2025

US House District Projected Loss of Medicaid Coverage
Statewide 310,000
PA-01: Bucks & Montgomery Counties 10,827
PA-02: Philadelphia County 36,198
PA-03: Philadelphia County 30,177
PA-04: Montgomery & Berks Counties 10,569
PA-05: Delaware, Chester, & Montgomery Counties 19,285
PA-06: Chester & Berks Counties 13,421
PA-07: Carbon, Lehigh, & Northampton Counties: 17,519
PA-08: Wayne, Pike, Lackawannna, Luzerne, & Monroe Counties 21,637
PA-09: Bradford, Columbia, Lebanon, Montour, Northumberland, Schuylkill, Sullivan, Susquehanna, Wyoming, Berks, Luzerne, and Lycoming Counties 17,967
PA-10: Dauphin, Cumberland, and York Counties 18,720
PA-11: Lancaster & York Counties 13,889
PA-12: Allegheny & Westmoreland Counties 17,727
PA-13: Adams, Bedford, Blair, Cambria, Franklin, Fulton, Huntingdon, Juniata, Mifflin, & Perry Counties 17,273
PA-14: Fayette, Greene, Washington, Indiana, Westmoreland, and Somerset Counties 18,645
PA-15: Armstrong, Cameron, Centre, Clarion, Clearfield, Clinton, Elk, Forest, Jefferson, McKean, Potter, Snyder, Tioga, Union, Warren, Indiana, Lycoming, & Venango Counties 15,215
PA-16: Erie, Crawford, Mercer, Lawrence, Butler, & Venango Counties 18,498
PA-17: Beaver & Allegheny Counties 12,584

PA House District Projected Loss of Medicaid Coverage
Statewide 310,000
HD-1: Erie County 3323
HD-2: Erie County 1927
HD-3: Erie County 1140
HD-4: Erie County 1513
HD-5: Berks County 870
HD-6: Crawford & Erie Counties 1486
HD-7: Mercer County 2036
HD-8: Butler & Lawrence Counties 963
HD-9: Lawrence County 1915
HD-10: Philadelphia County 2748
HD-11: Butler County 1325
HD-12: Butler County 574
HD-13: Chester County 901
HD-14: Beaver County 1389
HD-15: Beaver & Washington Counties 1271
HD-16: Beaver County 1706
HD-17: Butler & Mercer Counties 1103
HD-18: Bucks County 1420
HD-19: Allegheny County 2636
HD-20: Allegheny County 970
HD-21: Allegheny County 942
HD-22: Lehigh County 3203
HD-23: Allegheny County 487
HD-24: Allegheny County 1769
HD-25: Allegheny County: 1522
HD-26: Chester County 776
HD-27: Allegheny County 1261
HD-28: Allegheny County 483
HD-29: Bucks County 526
HD-30: Allegheny County 465
HD-31: Bucks County 425
HD-32: Allegheny County 1405
HD-33: Allegheny County 1141
HD-34: Allegheny County 1887
HD-35: Allegheny County 2544
HD-36: Allegheny County 1670
HD-37: Lancaster County 814
HD-38: Allegheny County 1458
HD-39: Allegheny & Washington County 1123
HD-40: Allegheny & Washington County 606
HD-41: Lancaster County 1389
HD-42: Allegheny County 665
HD-43: Lancaster County 983
HD-44: Allegheny County 741
HD-45: Allegheny County 1433
HD-46: Allegheny & Washington Counties 1011
HD-47: York County 1171
HD-48: Washington County 1636
HD-49: Lancaster County 2570
HD-50: Green & Washington Counties 2104
HD-51: Fayette County 2216
HD-52: Fayette County 1905
HD-53: Montgomery County 1193
HD-54: Montgomery County 1921
HD-55: Westmoreland County 1381
HD-56: Westmoreland County 1094
HD-57: Westmoreland County 1394
HD-58: Westmoreland County 1517
HD-59: Westmoreland County 1264
HD-60: Armstrong & Westmoreland Counties 1367
HD-61: Montgomery County 591
HD-62: Indiana County 1465
HD-63: Armstrong & Clarion Counties 1500
HD-64: Crawford & Venango Counties 1758
HD-65: Crawford, Forest, & Warren Counties 1315
HD-66: Indiana & Jefferson Counties 1528
HD-67: Cameron, McKean, & Potter Counties 1584
HD-68: Bradford & Tioga Counties 1547
HD-69: Somerset County 1419
HD-70: Montgomery County 787
HD-71: Cambria & Somerset County 1277
HD-72: Cambria County 2126
HD-73: Cambria & Clearfield Counties 1588
HD-74: Chester County 1537
HD-75: Clearfield & Elk Counties 1405
HD-76: Clinton & Union Counties 1338
HD-77: Centre County 567
HD-78: Bedford & Fulton Counties 1445
HD-79: Blair County 2152
HD-80: Blair & Huntingdon County 1335
HD-81: Franklin & Huntingdon Counties 1399
HD-82: Centre County 519
HD-83: Lycoming & Union Counties 1773
HD-84: Lycoming & Sullivan Counties 1233
HD-85: Juniata, Mifflin, Snyder, & Union Counties 1144
HD-86: Juniata & Perry Counties 1196
HD-87: Cumberland County 936
HD-88: Cumberland County 1050
HD-89: Franklin County 1597
HD-90: Franklin County 1142
HD-91: Adams County 1028
HD-92: York County 1026
HD-93: York County 950
HD-94: York County 1189
HD-95: York County 3451
HD-96: Lancaster County 1392
HD-97: Lancaster County 942
HD-98: Lancaster & Lebanon County 1017
HD-99: Berks & Lancaster County 820
HD-100: Lancaster County 867
HD-101: Lebanon County 1977
HD-102: Lebanon County 953
HD-103: Cumberland & Dauphin Counties 2211
HD-104: Dauphin County 2743
HD-105: Dauphin County 1746
HD-106: Dauphin County 978
HD-107: Northumberland & Schuylkill Counties 1792
HD-108: Montour & Northumberland Counties 1519
HD-109: Columbia County 1292
HD-110: Bradford & Wyoming Counties 1543
HD-111: Susquehanna & Wayne Counties 1473
HD-112: Lackawanna County 1601
HD-113: Lackawanna County 2257
HD-114: Lackawanna County 1560
HD-115: Monroe County 1589
HD-116: Luzerne & Schuylkill Counties 2831
HD-117: Luzerne County 1251
HD-118: Lackawanna & Luzerne Counties 1491
HD-119: Luzerne County 2256
HD-120: Luzerne County 1394
HD-121: Luzerne County 2640
HD-122: Carbon County 1485
HD-123: Schuylkill County 1961
HD-124: Berks & Schuylkill County 1172
HD-125: Dauphin County; 1084
HD-126: Berks County 1954
HD-127: Berks County 3078
HD-128: Berks County 788
HD-129: Berks County 2062
HD-130: Berks County 839
HD-131: Lehigh, Montgomery, and Northampton Counties 743
HD-132: Lehigh County 1226
HD-133: Lehigh County 1710
HD-134: Lehigh County 2314
HD-135: Northampton County 1640
HD-136: Northampton County 1554
HD-137: Northampton County 835
HD-138: Northampton County 969
HD-139: Pike & Wayne Counties 1207
HD-140: Bucks County 1154
HD-141: Bucks County 1753
HD-142: Bucks County 923
HD-143: Bucks County 692
HD-144: Bucks County 833
HD-145: Bucks County 849
HD-146: Montgomery County 1640
HD-147: Montgomery County 735
HD-148: Montgomery County 465
HD-149: Montgomery County 752
HD-150: Montgomery County 679
HD-151: Montgomery County 720
HD-152: Montgomery County 994
HD-153: Montgomery County 798
HD-154: Montgomery County 902
HD-155: Chester County 580
HD-156: Chester County 553
HD-157: Chester County 417
HD-158: Chester County 686
HD-159: Delaware County 2925
HD-160: Chester & Delaware Counties 396
HD-161: Delaware County 1201
HD-162: Delaware County 1708
HD-163: Delaware County 1693
HD-164: Delaware County 2548
HD-165: Delaware County 575
HD-166: Delaware County 620
HD-167: Chester County 557
HD-168: Delaware County 433
HD-169: York County 1101
HD-170: Philadelphia County 2044
HD-171: Centre & Mifflin Counties 1300
HD-172: Philadelphia County 2206
HD-173: Philadelphia County 2299
HD-174: Philadelphia County 2300
HD-175: Philadelphia County 1077
HD-176: Monroe County 1273
HD-177: Philadelphia County 2861
HD-178: Bucks County 640
HD-179: Philadelphia County 3903
HD-180: Philadelphia County 4621
HD-181: Philadelphia County 2841
HD-182: Philadelphia County 896
HD-183: Lehigh & Northampton Counties 1102
HD-184: Philadelphia County 2101
HD-185: Delaware & Philadelphia Counties 2631
HD-186: Philadelphia County 2689
HD-187: Lehigh County 827
HD-188: Philadelphia County 1753
HD-189: Monroe & Pike Counties 1562
HD-190: Philadelphia County 4007
HD-191: Delaware & Philadelphia Counties 3428
HD-192: Philadelphia County 2937
HD-193: Adams & Cumberland Counties 1135
HD-194: Philadelphia County 898
HD-195: Philadelphia County 2952
HD-196: York County 1164
HD-197: Philadelphia County 4382
HD-198: Philadelphia County 3656
HD-199: Cumberland County  1428
HD-200: Philadelphia County 2053
HD-201: Philadelphia County 3583
HD-202: Philadelphia County 3206
HD-203: Philadelphia County 3183

PA Senate District Projected Loss of Medicaid Coverage
Statewide 310,000
SD-01: Philadelphia County 5,734
SD-02: Philadelphia County 15,271
SD-03: Philadelphia County 14,754
SD-04: Montgomery & Philadelphia County 7,820
SD-05: Philadelphia County 9,681
SD-06: Bucks County 3,999
SD-07: Montngomery & Philadelphia Counties 9,985
SD-08: Delaware & Philadelphia Counties 11,476
SD-09: Chester & Delaware Counties 5,092
SD-10: Bucks County 3,854
SD-11: Berks County 8,021
SD-12: Montgomery County 3,500
SD-13: Berks & Lancaster Couties 5,723
SD-14: Lehigh & Northampton Counties 8,161
SD-15: Dauphin County 7,535
SD-16: Bucks & Lehigh Counties 3,677
SD-17: Delaware & Montgomery Counties 3,709
SD-18: Lehigh & Northampton Counties 5,306
SD-19: Chester County 3,087
SD-20: Luzerne, Pike, Susquehanna, Wayne, & Wyoming Counties 6,838
SD-21: Butler, Clarion, Erie, Forest, Venango, & Warren Counties 5,547
SD-22: Lackawanna & Luzerne Counties 8,094
SD-23: Bradford, Lycoming, Sullivan, Tioga, & Union Counties 5,938
SD-24: Berks & Montgomery Counties 3,884
SD-25: Cameron, Centre, Clinton, Elk, Jefferson, McKean, & Potter Counties 4,850
SD-26: Delaware County 5,685
SD-27: Columbia, Luzerne, Montour, Northumberland, & Snyder Counties 5,705
SD-28: York County 4,485
SD-29: Carbon, Luzerne, & Schuylkill Counties 7,794
SD-30: Blair, Fulton, Huntingdon, Juniata, & Mifflin Counties 6,337
SD-31: Cumberland & York Counties 6,622
SD-32: Bedford, Fayette, Somerset, & Westmoreland Counties 6,989
SD-33: Adams & Franklin Counties 4,848
SD-34: Cumberland, Dauphin, & Perry Counties 4,956
SD-35: Cambria, Centre, & Clearfield Counties 6,004
SD-36: Lancaster County 4,354
SD-37: Allegheny County 2,716
SD-38: Allegheny County 3,639
SD-39: Westmoreland County 4,903
SD-40: Lackawanna, Monroe, & Wayne Counties 6,096
SD-41: Armstrong, Indiana, Jefferson, & Westmoreland Counties 6,028
SD-42: Allegheny County 5,911
SD-43: Allegheny County 5,866
SD-44: Berks, Chester, & Montgomery Counties 3,010
SD-45: Allegheny County 6,793
SD-46: Beaver, Greene, & Washington Counties 5,786
SD-47: Beaver, Butler, & Lawrence Counties 4,683
SD-48: Berks, Lancaster, & Lebanon Counties 4,829
SD-49: Erie County 7,819
SD-50: Crawford, Lawrence, & Mercer Counties 6,756

Map of PA counties with total loss of Medicaid coverage.
PA County Estimated MA loss of coverage
Statewide 310,000
Adams 1,676
Allegheny 25,871
Armstrong 1,466
Beaver 3,550
Bedford 1,118
Berks 9,817
Blair 3,430
Bradford 1,327
Bucks 9,329
Butler 2,652
Cambria 3,519
Cameron 133
Carbon 1,509
Centre 1,632
Chester 5,914
Clarion -761
Clearfield -2,006
Clinton -881
Columbia 1,305
Crawford 1,900
Cumberland 4,530
Dauphin 7,830
Delaware 13,372
Elk 582
Erie 7,702
Fayette 4,080
Forest 97
Franklin 3,070
Fulton 329
Greene 980
Huntingdon 890
Indiana 1,942
Jefferson 1,003
Juniata 417
Lackawanna 6,289
Lancaster 10,474
Lawrence 2,275
Lebanon 2,865
Lehigh 9,893
Luzerne 10,336
Lycoming 2,667
McKean 1,010
Mercer 2,656
Mifflin 1,050
Monroe 4,321
Montgomery 12,009
Montour 292
Northampton 5,512
Northumberland 2,489
Perry 793
Philadelphia 73,248
Pike 1,231
Potter 374
Schuylkill 3,593
Snyder 645
Somerset 1,570
Sullivan 109
Susquehanna 901
Tioga 992
Union 560
Venango 1,335
Warren 881
Washington 4,657
Wayne 1,099
Westmoreland 6,867
Wyoming 622
York 9,762

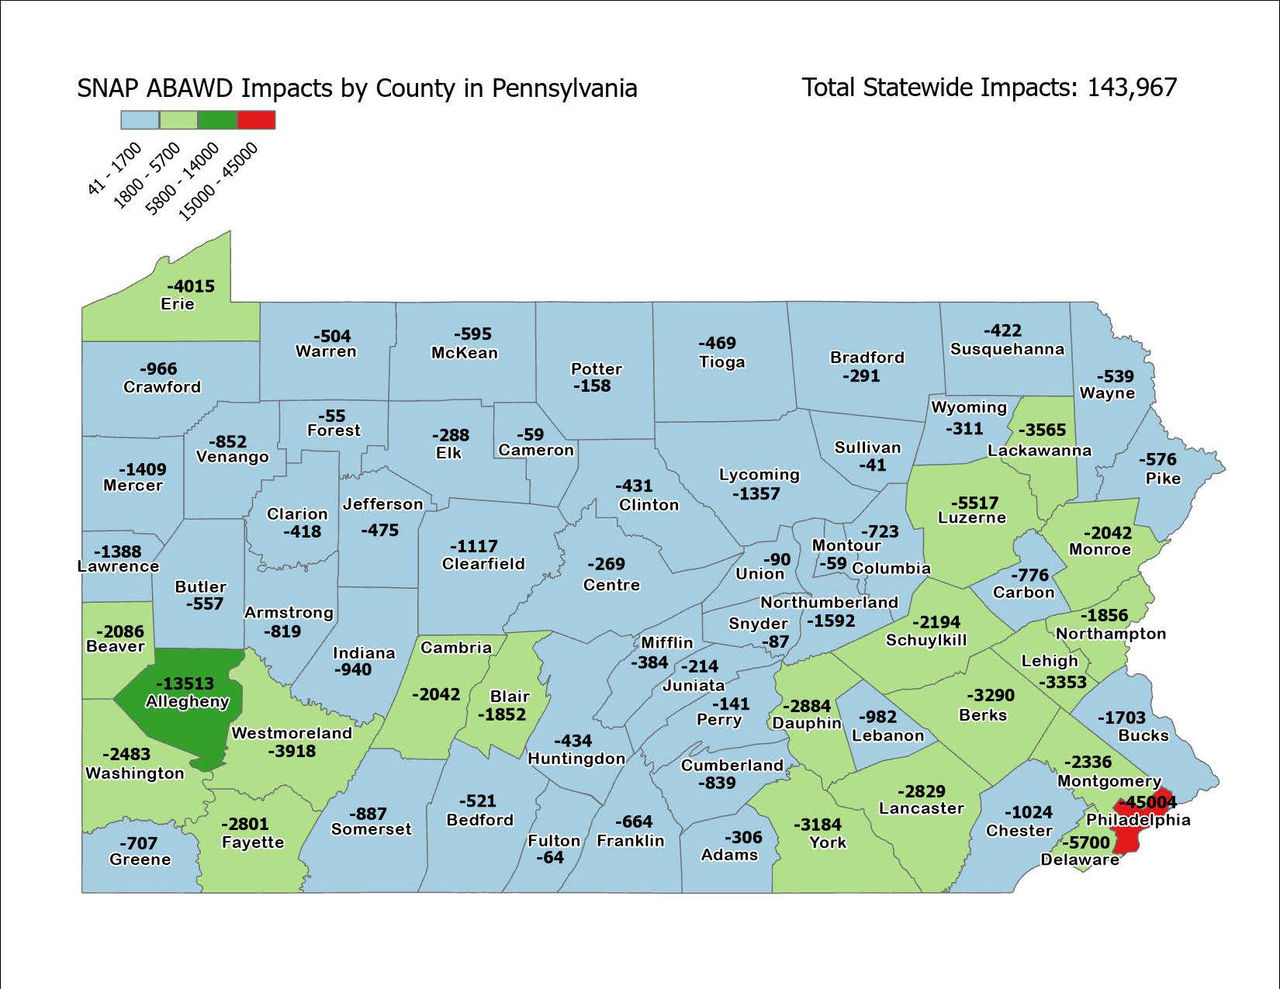
Projected Pennsylvanians who will Lose SNAP Due to Federal Changes by:

Data as of July 2025

US House District Projected Loss of SNAP
Statewide 143,968
PA-01: Bucks & Montgomery Counties 2,027
PA-02: Philadelphia County 21,857
PA-03: Philadelphia County 20,899
PA-04: Montgomery & Berks Counties 2,115
PA-05: Delaware, Chester, & Montgomery Counties 8,284
PA-06: Chester & Berks Counties 3,639
PA-07: Carbon, Lehigh, & Northampton Counties: 6,096
PA-08: Wayne, Pike, Lackawannna, Luzerne, & Monroe Counties 11,572
PA-09: Bradford, Columbia, Lebanon, Montour, Northumberland, Schuylkill, Sullivan, Susquehanna, Wyoming, Berks, Luzerne, and Lycoming Counties 8,185
PA-10: Dauphin, Cumberland, and York Counties 6,029
PA-11: Lancaster & York Counties 3,509
PA-12: Allegheny & Westmoreland Counties 9,898
PA-13: Adams, Bedford, Blair, Cambria, Franklin, Fulton, Huntingdon, Juniata, Mifflin, & Perry Counties 6,626
PA-14: Fayette, Greene, Washington, Indiana, Westmoreland, and Somerset Counties 11,071
PA-15: Armstrong, Cameron, Centre, Clarion, Clearfield, Clinton, Elk, Forest, Jefferson, McKean, Potter, Snyder, Tioga, Union, Warren, Indiana, Lycoming, & Venango Counties 6,825
PA-16: Erie, Crawford, Mercer, Lawrence, Butler, & Venango Counties 8,751
PA-17: Beaver & Allegheny Counties 6,004
Unknown 581

PA House District Projected Loss of SNAP
Statewide 143,968
HD-1: Erie County 2,070
HD-2: Erie County 865
HD-3: Erie County 425
HD-4: Erie County 692
HD-5: Berks County 206
HD-6: Crawford & Erie Counties 698
HD-7: Mercer County 1,070
HD-8: Butler & Lawrence Counties 396
HD-9: Lawrence County 1,167
HD-10: Philadelphia County 1,996
HD-11: Butler County 301
HD-12: Butler County 89
HD-13: Chester County 153
HD-14: Beaver County 764
HD-15: Beaver & Washington Counties 671
HD-16: Beaver County 1,008
HD-17: Butler & Mercer Counties 423
HD-18: Bucks County 275
HD-19: Allegheny County 1,701
HD-20: Allegheny County 452
HD-21: Allegheny County 549
HD-22: Lehigh County 1,518
HD-23: Allegheny County 191
HD-24: Allegheny County 1,064
HD-25: Allegheny County: 792
HD-26: Chester County 131
HD-27: Allegheny County 573
HD-28: Allegheny County 164
HD-29: Bucks County 87
HD-30: Allegheny County 131
HD-31: Bucks County 63
HD-32: Allegheny County 720
HD-33: Allegheny County 567
HD-34: Allegheny County 1,165
HD-35: Allegheny County 1,524
HD-36: Allegheny County 950
HD-37: Lancaster County 142
HD-38: Allegheny County 658
HD-39: Allegheny & Washington County 547
HD-40: Allegheny & Washington County 177
HD-41: Lancaster County 275
HD-42: Allegheny County 250
HD-43: Lancaster County 151
HD-44: Allegheny County 246
HD-45: Allegheny County 710
HD-46: Allegheny & Washington Counties 429
HD-47: York County 250
HD-48: Washington County 1,000
HD-49: Lancaster County 1,080
HD-50: Green & Washington Counties 1,326
HD-51: Fayette County 1,560
HD-52: Fayette County 1,181
HD-53: Montgomery County 206
HD-54: Montgomery County 484
HD-55: Westmoreland County 831
HD-56: Westmoreland County 574
HD-57: Westmoreland County 813
HD-58: Westmoreland County 871
HD-59: Westmoreland County 717
HD-60: Armstrong & Westmoreland Counties 771
HD-61: Montgomery County 100
HD-62: Indiana County 724
HD-63: Armstrong & Clarion Counties 733
HD-64: Crawford & Venango Counties 1,031
HD-65: Crawford, Forest, & Warren Counties 676
HD-66: Indiana & Jefferson Counties 691
HD-67: Cameron, McKean, & Potter Counties 797
HD-68: Bradford & Tioga Counties 593
HD-69: Somerset County 829
HD-70: Montgomery County 144
HD-71: Cambria & Somerset County 647
HD-72: Cambria County 1,189
HD-73: Cambria & Clearfield Counties 913
HD-74: Chester County 330
HD-75: Clearfield & Elk Counties 673
HD-76: Clinton & Union Counties 479
HD-77: Centre County 107
HD-78: Bedford & Fulton Counties 562
HD-79: Blair County 1,245
HD-80: Blair & Huntingdon County 578
HD-81: Franklin & Huntingdon Counties 537
HD-82: Centre County 98
HD-83: Lycoming & Union Counties 882
HD-84: Lycoming & Sullivan Counties 510
HD-85: Juniata, Mifflin, Snyder, & Union Counties 213
HD-86: Juniata & Perry Counties 328
HD-87: Cumberland County 161
HD-88: Cumberland County 182
HD-89: Franklin County 299
HD-90: Franklin County 265
HD-91: Adams County 195
HD-92: York County 222
HD-93: York County 175
HD-94: York County 272
HD-95: York County 1,832
HD-96: Lancaster County 556
HD-97: Lancaster County 167
HD-98: Lancaster & Lebanon County 186
HD-99: Berks & Lancaster County 145
HD-100: Lancaster County 167
HD-101: Lebanon County 782
HD-102: Lebanon County 186
HD-103: Cumberland & Dauphin Counties 1,173
HD-104: Dauphin County 1,016
HD-105: Dauphin County 338
HD-106: Dauphin County 189
HD-107: Northumberland & Schuylkill Counties 1,171
HD-108: Montour & Northumberland Counties 678
HD-109: Columbia County 673
HD-110: Bradford & Wyoming Counties 540
HD-111: Susquehanna & Wayne Counties 708
HD-112: Lackawanna County 931
HD-113: Lackawanna County 1,279
HD-114: Lackawanna County 817
HD-115: Monroe County 853
HD-116: Luzerne & Schuylkill Counties 1,191
HD-117: Luzerne County 673
HD-118: Lackawanna & Luzerne Counties 810
HD-119: Luzerne County 1,328
HD-120: Luzerne County 693
HD-121: Luzerne County 1,565
HD-122: Carbon County 733
HD-123: Schuylkill County 1,264
HD-124: Berks & Schuylkill County 467
HD-125: Dauphin County; 208
HD-126: Berks County 612
HD-127: Berks County 1,288
HD-128: Berks County 143
HD-129: Berks County 734
HD-130: Berks County 144
HD-131: Lehigh, Montgomery, and Northampton Counties 171
HD-132: Lehigh County 317
HD-133: Lehigh County 354
HD-134: Lehigh County 833
HD-135: Northampton County 672
HD-136: Northampton County 673
HD-137: Northampton County 193
HD-138: Northampton County 224
HD-139: Pike & Wayne Counties 625
HD-140: Bucks County 266
HD-141: Bucks County 434
HD-142: Bucks County 143
HD-143: Bucks County 103
HD-144: Bucks County 137
HD-145: Bucks County 139
HD-146: Montgomery County 430
HD-147: Montgomery County 131
HD-148: Montgomery County 69
HD-149: Montgomery County 138
HD-150: Montgomery County 131
HD-151: Montgomery County 113
HD-152: Montgomery County 171
HD-153: Montgomery County 116
HD-154: Montgomery County 155
HD-155: Chester County 89
HD-156: Chester County 88
HD-157: Chester County 56
HD-158: Chester County 107
HD-159: Delaware County 1,648
HD-160: Chester & Delaware Counties 94
HD-161: Delaware County 520
HD-162: Delaware County 733
HD-163: Delaware County 722
HD-164: Delaware County 915
HD-165: Delaware County 208
HD-166: Delaware County 162
HD-167: Chester County 60
HD-168: Delaware County 98
HD-169: York County 222
HD-170: Philadelphia County 762
HD-171: Centre & Mifflin Counties 424
HD-172: Philadelphia County 799
HD-173: Philadelphia County 1,116
HD-174: Philadelphia County 906
HD-175: Philadelphia County 844
HD-176: Monroe County 632
HD-177: Philadelphia County 1,918
HD-178: Bucks County 84
HD-179: Philadelphia County 2,589
HD-180: Philadelphia County 3,459
HD-181: Philadelphia County 2,091
HD-182: Philadelphia County 879
HD-183: Lehigh & Northampton Counties 220
HD-184: Philadelphia County 1,140
HD-185: Delaware & Philadelphia Counties 1,509
HD-186: Philadelphia County 1,854
HD-187: Lehigh County 129
HD-188: Philadelphia County 1,496
HD-189: Monroe & Pike Counties 777
HD-190: Philadelphia County 2,871
HD-191: Delaware & Philadelphia Counties 2,145
HD-192: Philadelphia County 1,998
HD-193: Adams & Cumberland Counties 198
HD-194: Philadelphia County 590
HD-195: Philadelphia County 2,104
HD-196: York County 209
HD-197: Philadelphia County 2,947
HD-198: Philadelphia County 2,487
HD-199: Cumberland County  274
HD-200: Philadelphia County 1,368
HD-201: Philadelphia County 2,357
HD-202: Philadelphia County 1,392
HD-203: Philadelphia County 1,543

PA Senate District Projected Loss of SNAP
Statewide 143,968
SD-01: Philadelphia County 4,032
SD-02: Philadelphia County 9,660
SD-03: Philadelphia County 10,153
SD-04: Montgomery & Philadelphia County 4,370
SD-05: Philadelphia County 4,008
SD-06: Bucks County 693
SD-07: Montngomery & Philadelphia Counties 6,776
SD-08: Delaware & Philadelphia Counties 7,306
SD-09: Chester & Delaware Counties 2,253
SD-10: Bucks County 808
SD-11: Berks County 2,825
SD-12: Montgomery County 571
SD-13: Berks & Lancaster Couties 1,855
SD-14: Lehigh & Northampton Counties 2,932
SD-15: Dauphin County 2,690
SD-16: Bucks & Lehigh Counties 689
SD-17: Delaware & Montgomery Counties 840
SD-18: Lehigh & Northampton Counties 1,844
SD-19: Chester County 549
SD-20: Luzerne, Pike, Susquehanna, Wayne, & Wyoming Counties 3,771
SD-21: Butler, Clarion, Erie, Forest, Venango, & Warren Counties 2,489
SD-22: Lackawanna & Luzerne Counties 4,598
SD-23: Bradford, Lycoming, Sullivan, Tioga, & Union Counties 2,237
SD-24: Berks & Montgomery Counties 843
SD-25: Cameron, Centre, Clinton, Elk, Jefferson, McKean, & Potter Counties 2,014
SD-26: Delaware County 2,133
SD-27: Columbia, Luzerne, Montour, Northumberland, & Snyder Counties 2,794
SD-28: York County 954
SD-29: Carbon, Luzerne, & Schuylkill Counties 3,943
SD-30: Blair, Fulton, Huntingdon, Juniata, & Mifflin Counties 2,951
SD-31: Cumberland & York Counties 2,414
SD-32: Bedford, Fayette, Somerset, & Westmoreland Counties 4,281
SD-33: Adams & Franklin Counties 972
SD-34: Cumberland, Dauphin, & Perry Counties 931
SD-35: Cambria, Centre, & Clearfield Counties 3,088
SD-36: Lancaster County 890
SD-37: Allegheny County 946
SD-38: Allegheny County 1,760
SD-39: Westmoreland County 2,735
SD-40: Lackawanna, Monroe, & Wayne Counties 3,152
SD-41: Armstrong, Indiana, Jefferson, & Westmoreland Counties 3,242
SD-42: Allegheny County 3,284
SD-43: Allegheny County 3,354
SD-44: Berks, Chester, & Montgomery Counties 496
SD-45: Allegheny County 3,591
SD-46: Beaver, Greene, & Washington Counties 3,333
SD-47: Beaver, Butler, & Lawrence Counties 2,326
SD-48: Berks, Lancaster, & Lebanon Counties 1,307
SD-49: Erie County 3,963
SD-50: Crawford, Lawrence, & Mercer Counties 3,481
Unknown 578

Map of PA counties with total loss of SNAP.
PA County Projected Loss of SNAP
Statewide 143,967
Adams 306
Allegheny 13,513
Armstrong 819
Beaver 2,086
Bedford 521
Berks 3,290
Blair 1,852
Bradford 291
Bucks 1,703
Butler 557
Cambria 2,042
Cameron 59
Carbon 776
Centre 269
Chester 1,024
Clarion 418
Clearfield 1,117
Clinton 431
Columbia 723
Crawford 966
Cumberland 839
Dauphin 2,884
Delaware 5,700
Elk 288
Erie 4,015
Fayette 2,801
Forest 55
Franklin 664
Fulton 64
Greene 707
Huntingdon 434
Indiana 940
Jefferson 475
Juniata 214
Lackawanna 3,565
Lancaster 2,829
Lawrence 1,388
Lebanon 982
Lehigh 3,353
Luzerne 5,517
Lycoming 1,357
McKean 595
Mercer 1,409
Mifflin 384
Monroe 2,042
Montgomery 2,336
Montour 59
Northampton 1,856
Northumberland 1,592
Perry 141
Philadelphia 45,004
Pike 576
Potter 158
Schuylkill 2,194
Snyder 87
Somerset 887
Sullivan 41
Susquehanna 422
Tioga 469
Union 90
Venango 852
Warren 504
Washington 2,483
Wayne 539
Westmoreland 3,918
Wyoming 311
York 3,184

DHS serves more than 3 million Pennsylvanians directly
through programs we administer like Medicaid, the Supplemental Nutrition Assistance Program (SNAP), and more.

The agency reaches countless others in our Commonwealth through protective services, support for county-level human services programs, and work to oversee licensed providers that offer child care, behavioral health care, long-term care, disability supports, and other essential services. Download statewide, county, and localized data on Medicaid and SNAP (xlsx) — two of DHS' largest programs

Medicaid Information

Medicaid is a health care program overseen by the federal government but managed by states.

In Pennsylvania, Medicaid covers approximately 3 million people who live in every county in the Commonwealth.

23% of all Pennsylvanians

Infographic of people icon showing 23 percent of icons shaded in.

39% of Children
(under 21)

Infographic of people icon showing 39 percent of icons shaded in.

34% of births
in PA

Infographic of people icon showing 34 percent of icons shaded in.

21% of Adults
(19-64)

Infographic of people icon showing 21percent of icons shaded in.

13% of Seniors
(65 and over)

Infographic of people icon showing 13 percent of icons shaded in.

59% of Nursing Home Residents

Infographic of people icon showing 59 percent of icons shaded in.

Medicaid helps eligible people without health insurance and people with special health needs get the care they need to stay healthy, support their family, and participate in Pennsylvania’s workforce and economy.

In 2015, Pennsylvania implemented Medicaid Expansion, part of the Affordable Care Act that allows low income people who don’t get health coverage from an employer or don’t make enough to qualify for subsidies from Pennie, Pennsylvania’s health insurance marketplace, to get health coverage through Medicaid.

Today, about 750,000 Pennsylvanians get health care because of Medicaid Expansion and since 2015, more than 2.5 million have received coverage at some point because of Medicaid Expansion.

As of 2023, hospital uncompensated care is 27.7% less than it was prior to Medicaid expansion even though health care costs have increased during this time.

A small graphic of a person next to a 2-times bigger graphic of a person. Text on graphic reads: "Medicaid positively impacts uninsured rates and long term outcomes in PA. 7.1% PA's Current Uninsured Rate. 13.6% PA's potential Uninsured Rate if Expansion is Rolled Back"

Medicaid Data

More Medicaid data

Changes to our Medicaid program could jeopardize access to life-saving behavioral health care and worsen the already devastating mental health, suicide, addiction, and overdose crises in rural, suburban, and urban communities across Pennsylvania. Families facing serious mental health challenges or addiction could see their loved ones lose critical access to treatment and recovery supports that save lives.

Potential changes wouldn’t just impact those on Medicaid. They would also affect working families who are a part of the behavioral health workforce by creating more turbulence for an essential field – impacts that can extend across our economy. 

Data as of October 2025

PA County Individuals receiving Medicaid
STATE TOTAL 2,942,780
Adams 15,769
Allegheny 238,873
Armstrong 14,251
Beaver 35,300
Bedford 10,736
Berks 97,475
Blair 33,098
Bradford 14,017
Bucks 88,902
Butler 25,834
Cambria 34,668
Cameron 1,323
Carbon 14,582
Centre 14,567
Chester 58,444
Clarion 7,760
Clearfield 19,060
Clinton 8,935
Columbia 12,658
Crawford 18,674
Cumberland 44,998
Dauphin 77,663
Delaware 125,292
Elk 6,085
Erie 75,450
Fayette 39,424
Forest 996
Franklin 30,497
Fulton 3,341
Greene 9,363
Huntingdon 9,022
Indiana 17,945
Jefferson 10,418
Juniata 4,122
Lackawanna 58,810
Lancaster 97,369
Lawrence 22,043
Lebanon 29,354
Lehigh 94,808
Luzerne 98,888
Lycoming 26,940
McKean 10,322
Mercer 26,560
Mifflin 10,775
Monroe 37,831
Montgomery 120,255
Montour 2,985
Northampton 54,320
Northumberland 25,310
Perry 7,880
Philadelphia 660,463
Pike 10,674
Potter 3,622
Schuylkill 36,441
Snyder 6,627
Somerset 15,020
Sullivan 1,115
Susquehanna 8,807
Tioga 9,376
Union 5,539
Venango 13,385
Warren 8,462
Washington 42,655
Wayne 10,083
Westmoreland 66,312
Wyoming 5,845
York 94,362

Data as of October 2025

US House District Number on Medicaid under 21 years of age Number on Medicaid ages 21 to 59 Number on Medicaid 60 and older Those eligible for Medicaid because of Medicaid Expansion
Total 1,234,008 1,242,748 462,390 2,939,146
PA-01: Bucks & Montgomery Counties 46,375 39,623 17,554 103,552
PA-02: Philadelphia County 137,098 147,691 57,217 342,006
PA-03: Philadelphia County 107,378 128,361 51,148 286,887
PA-04: Montgomery & Berks Counties 45,488 39,837 15,797 101,122
PA-05: Delaware, Chester, & Montgomery Counties 79,735 73,363 27,814 180,912
PA-06: Chester & Berks Counties 60,377 47,430 18,650 126,457
PA-07: Carbon, Lehigh, & Northampton Counties: 72,572 67,106 26,413 166,091
PA-08: Wayne, Pike, Lackawannna, Luzerne, & Monroe Counties 88,079 88,548 29,565 206,192
PA-09: Bradford, Columbia, Lebanon, Montour, Northumberland, Schuylkill, Sullivan, Susquehanna, Wyoming, Berks, Luzerne, and Lycoming Counties 73,344 72,477 26,541 172,362
PA-10: Dauphin, Cumberland, and York Counties 80,321 73,818 23,820 177,959
PA-11: Lancaster & York Counties 58,750 54,562 16,646 129,958
PA-12: Allegheny & Westmoreland Counties 67,721 72,373 26,639 166,733
PA-13: Adams, Bedford, Blair, Cambria, Franklin, Fulton, Huntingdon, Juniata, Mifflin, & Perry Counties 69,275 69,954 25,362 164,591
PA-14: Fayette, Greene, Washington, Indiana, Westmoreland, and Somerset Counties 67,861 78,904 29,516 176,281
PA-15: Armstrong, Cameron, Centre, Clarion, Clearfield, Clinton, Elk, Forest, Jefferson, McKean, Potter, Snyder, Tioga, Union, Warren, Indiana, Lycoming, & Venango Counties 57,517 63,293 23,990 144,800
PA-16: Erie, Crawford, Mercer, Lawrence, Butler, & Venango Counties 72,820 75,115 26,552 174,487
PA-17: Beaver & Allegheny Counties 49,297 50,293 19,166 118,756


Data as of October 2025

PA House District Under 21  Age 21-59  Age 60+  Total 
Total 1,234,008 1,242,748 462,390 2,939,146
HD-1: Erie County 12,675 14,300 4,275 31,250
HD-2: Erie County 8,231 7,589 2,332 18,152
HD-3: Erie County 4,560 4,532 1,810 10,902
HD-4: Erie County 6,289 6,067 1,801 14,157
HD-5: Berks County 3,738 3,475 1,075 8,288
HD-6: Crawford & Erie Counties 5,589 5,837 2,393 13,819
HD-7: Mercer County 7,735 8,477 2,957 19,169
HD-8: Butler & Lawrence Counties 3,790 3,936 1,402 9,128
HD-9: Lawrence County 7,136 8,039 3,012 18,187
HD-10: Philadelphia County 9,599 11,941 4,987 26,527
HD-11: Butler County 4,983 5,468 2,056 12,507
HD-12: Butler County 2,708 1,827 839 5,374
HD-13: Chester County 4,643 2,834 1,065 8,542
HD-14: Beaver County 5,582 5,597 2,038 13,217
HD-15: Beaver & Washington Counties 4,942 5,013 2,074 12,029
HD-16: Beaver County 6,628 7,039 2,495 16,162
HD-17: Butler & Mercer Counties 4,380 4,358 1,722 10,460
HD-18: Bucks County 5,846 4,954 2,711 13,511
HD-19: Allegheny County 9,754 10,922 4,141 24,817
HD-20: Allegheny County 3,681 3,927 1,581 9,189
HD-21: Allegheny County 2,955 4,142 1,654 8,751
HD-22: Lehigh County 13,196 12,383 4,314 29,893
HD-23: Allegheny County 1,501 1,974 965 4,440
HD-24: Allegheny County 5,955 7,051 3,235 16,241
HD-25: Allegheny County: 6,323 6,258 1,997 14,578
HD-26: Chester County 3,621 2,736 1,049 7,406
HD-27: Allegheny County 4,867 4,926 1,895 11,688
HD-28: Allegheny County 2,181 1,742 636 4,559
HD-29: Bucks County 2,009 1,841 1,247 5,097
HD-30: Allegheny County 1,996 1,664 705 4,365
HD-31: Bucks County 1,734 1,510 743 3,987
HD-32: Allegheny County 5,551 5,616 2,020 13,187
HD-33: Allegheny County 4,247 4,591 1,909 10,747
HD-34: Allegheny County 6,727 8,157 2,970 17,854
HD-35: Allegheny County 9,806 10,228 3,782 23,816
HD-36: Allegheny County 6,341 7,157 2,248 15,746
HD-37: Lancaster County 3,499 3,079 940 7,518
HD-38: Allegheny County 5,740 5,890 2,017 13,647
HD-39: Allegheny & Washington County 4,655 4,600 1,557 10,812
HD-40: Allegheny & Washington County 2,808 2,150 910 5,868
HD-41: Lancaster County 5,821 5,370 1,833 13,024
HD-42: Allegheny County 2,856 2,539 984 6,379
HD-43: Lancaster County 4,388 3,739 1,095 9,222
HD-44: Allegheny County 3,311 2,745 878 6,934
HD-45: Allegheny County 5,371 5,908 2,244 13,523
HD-46: Allegheny & Washington Counties 4,318 3,712 1,581 9,611
HD-47: York County 5,243 4,500 1,456 11,199
HD-48: Washington County 5,968 7,034 2,362 15,364
HD-49: Lancaster County 9,825 10,199 3,332 23,356
HD-50: Green & Washington Counties 7,286 9,093 2,925 19,304
HD-51: Fayette County 7,497 9,608 4,000 21,105
HD-52: Fayette County 6,803 8,050 3,011 17,864
HD-53: Montgomery County 5,251 4,106 2,026 11,383
HD-54: Montgomery County 9,514 6,850 2,240 18,604
HD-55: Westmoreland County 5,271 5,766 2,115 13,152
HD-56: Westmoreland County 4,386 4,431 1,523 10,340
HD-57: Westmoreland County 4,979 6,045 2,431 13,455
HD-58: Westmoreland County 5,747 6,445 2,201 14,393
HD-59: Westmoreland County 4,597 5,234 2,164 11,995
HD-60: Armstrong & Westmoreland Counties 5,227 5,748 2,052 13,027
HD-61: Montgomery County 2,371 2,080 1,286 5,737
HD-62: Indiana County 5,212 6,453 2,186 13,851
HD-63: Armstrong & Clarion Counties 5,502 6,020 2,528 14,050
HD-64: Crawford & Venango Counties 6,774 7,198 2,852 16,824
HD-65: Crawford, Forest, & Warren Counties 4,902 5,319 2,308 12,529
HD-66: Indiana & Jefferson Counties 5,769 6,349 2,500 14,618
HD-67: Cameron, McKean, & Potter Counties 6,054 6,593 2,535 15,182
HD-68: Bradford & Tioga Counties 6,205 6,193 2,405 14,803
HD-69: Somerset County 5,163 5,858 2,406 13,427
HD-70: Montgomery County 3,322 2,925 1,339 7,586
HD-71: Cambria & Somerset County 4,777 5,310 2,027 12,114
HD-72: Cambria County 7,989 8,852 3,391 20,232
HD-73: Cambria & Clearfield Counties 5,684 6,814 2,534 15,032
HD-74: Chester County 7,264 5,636 1,671 14,571
HD-75: Clearfield & Elk Counties 5,281 6,003 2,105 13,389
HD-76: Clinton & Union Counties 5,044 5,583 2,121 12,748
HD-77: Centre County 2,160 2,445 816 5,421
HD-78: Bedford & Fulton Counties 5,645 5,820 2,411 13,876
HD-79: Blair County 7,761 9,499 3,202 20,462
HD-80: Blair & Huntingdon County 5,305 5,369 2,012 12,686
HD-81: Franklin & Huntingdon Counties 5,689 5,580 1,999 13,268
HD-82: Centre County 1,899 2,049 871 4,819
HD-83: Lycoming & Union Counties 6,907 7,543 2,691 17,141
HD-84: Lycoming & Sullivan Counties 4,795 4,960 1,925 11,680
HD-85: Juniata, Mifflin, Snyder, & Union Counties 4,739 4,474 1,898 11,111
HD-86: Juniata & Perry Counties 5,042 4,590 1,755 11,387
HD-87: Cumberland County 4,070 3,448 1,217 8,735
HD-88: Cumberland County 4,834 4,055 1,387 10,276
HD-89: Franklin County 7,070 5,988 2,108 15,166
HD-90: Franklin County 5,030 4,579 1,313 10,922
HD-91: Adams County 4,359 3,908 1,439 9,706
HD-92: York County 4,675 4,090 1,124 9,889
HD-93: York County 4,256 3,733 1,196 9,185
HD-94: York County 5,244 4,689 1,250 11,183
HD-95: York County 14,446 14,073 3,802 32,321
HD-96: Lancaster County 5,235 5,929 2,058 13,222
HD-97: Lancaster County 4,159 3,718 1,047 8,924
HD-98: Lancaster & Lebanon County 4,340 3,912 1,239 9,491
HD-99: Berks & Lancaster County 3,738 2,942 945 7,625
HD-100: Lancaster County 3,736 3,281 946 7,963
HD-101: Lebanon County 8,368 7,549 2,864 18,781
HD-102: Lebanon County 4,487 3,568 1,117 9,172
HD-103: Cumberland & Dauphin Counties 8,946 9,214 2,974 21,134
HD-104: Dauphin County 12,282 10,668 3,437 26,387
HD-105: Dauphin County 7,236 6,839 2,215 16,290
HD-106: Dauphin County 4,161 3,838 1,312 9,311
HD-107: Northumberland & Schuylkill Counties 7,009 7,570 2,690 17,269
HD-108: Montour & Northumberland Counties 5,915 6,104 2,651 14,670
HD-109: Columbia County 5,015 5,168 2,062 12,245
HD-110: Bradford & Wyoming Counties 6,262 6,409 2,027 14,698
HD-111: Susquehanna & Wayne Counties 5,952 6,072 2,140 14,164
HD-112: Lackawanna County 6,179 6,768 2,216 15,163
HD-113: Lackawanna County 8,931 9,264 3,557 21,752
HD-114: Lackawanna County 6,197 6,355 2,348 14,900
HD-115: Monroe County 6,607 6,637 1,954 15,198
HD-116: Luzerne & Schuylkill Counties 12,865 9,909 3,850 26,624
HD-117: Luzerne County 4,909 5,220 1,648 11,777
HD-118: Lackawanna & Luzerne Counties 5,817 6,100 2,195 14,112
HD-119: Luzerne County 9,499 9,413 2,583 21,495
HD-120: Luzerne County 5,697 5,867 2,013 13,577
HD-121: Luzerne County 10,896 10,916 3,310 25,122
HD-122: Carbon County 6,257 5,969 1,902 14,128
HD-123: Schuylkill County 7,732 8,426 2,997 19,155
HD-124: Berks & Schuylkill County 4,992 4,608 1,926 11,526
HD-125: Dauphin County; 4,652 4,314 1,556 10,522
HD-126: Berks County 8,986 6,924 2,422 18,332
HD-127: Berks County 12,962 10,928 4,755 28,645
HD-128: Berks County 3,471 3,066 1,015 7,552
HD-129: Berks County 8,701 7,568 3,155 19,424
HD-130: Berks County 3,613 3,108 1,024 7,745
HD-131: Lehigh, Montgomery, and Northampton Counties 3,304 2,842 1,051 7,197
HD-132: Lehigh County 4,919 4,307 2,446 11,672
HD-133: Lehigh County 6,910 6,320 3,010 16,240
HD-134: Lehigh County 9,826 8,755 3,322 21,903
HD-135: Northampton County 6,696 6,429 2,529 15,654
HD-136: Northampton County 6,297 6,236 2,374 14,907
HD-137: Northampton County 3,361 2,975 1,616 7,952
HD-138: Northampton County 4,003 3,774 1,347 9,124
HD-139: Pike & Wayne Counties 4,582 5,013 1,730 11,325
HD-140: Bucks County 5,066 4,480 1,585 11,131
HD-141: Bucks County 7,058 7,191 2,385 16,634
HD-142: Bucks County 3,915 3,375 1,469 8,759
HD-143: Bucks County 3,216 2,503 826 6,545
HD-144: Bucks County 3,961 2,754 1,276 7,991
HD-145: Bucks County 3,636 3,183 1,333 8,152
HD-146: Montgomery County 7,199 6,614 1,787 15,600
HD-147: Montgomery County 3,414 2,685 899 6,998
HD-148: Montgomery County 1,944 1,654 921 4,519
HD-149: Montgomery County 3,119 2,812 1,113 7,044
HD-150: Montgomery County 3,082 2,548 942 6,572
HD-151: Montgomery County 3,126 2,518 1,365 7,009
HD-152: Montgomery County 4,346 3,714 1,509 9,569
HD-153: Montgomery County 3,330 2,908 1,424 7,662
HD-154: Montgomery County 3,510 3,403 1,676 8,589
HD-155: Chester County 2,781 2,068 729 5,578
HD-156: Chester County 2,415 1,986 813 5,214
HD-157: Chester County 1,722 1,494 738 3,954
HD-158: Chester County 3,488 2,153 828 6,469
HD-159: Delaware County 11,763 11,621 3,705 27,089
HD-160: Chester & Delaware Counties 1,617 1,425 577 3,619
HD-161: Delaware County 5,014 4,530 1,737 11,281
HD-162: Delaware County 7,051 6,659 2,234 15,944
HD-163: Delaware County 7,377 6,800 2,048 16,225
HD-164: Delaware County 10,667 9,367 3,725 23,759
HD-165: Delaware County 2,270 2,240 973 5,483
HD-166: Delaware County 2,396 2,126 1,309 5,831
HD-167: Chester County 2,392 1,734 1,115 5,241
HD-168: Delaware County 1,548 1,488 1,086 4,122
HD-169: York County 5,104 4,367 1,146 10,617
HD-170: Philadelphia County 8,051 7,515 3,955 19,521
HD-171: Centre & Mifflin Counties 5,027 5,718 1,857 12,602
HD-172: Philadelphia County 9,001 7,842 4,207 21,050
HD-173: Philadelphia County 9,842 9,132 3,121 22,095
HD-174: Philadelphia County 9,233 8,396 4,264 21,893
HD-175: Philadelphia County 1,965 5,455 2,802 10,222
HD-176: Monroe County 4,924 5,450 1,744 12,118
HD-177: Philadelphia County 11,154 12,099 3,688 26,941
HD-178: Bucks County 2,828 2,293 1,092 6,213
HD-179: Philadelphia County 14,954 16,486 5,212 36,652
HD-180: Philadelphia County 16,865 20,308 6,271 43,444
HD-181: Philadelphia County 11,063 11,794 4,722 27,579
HD-182: Philadelphia County 1,581 4,960 2,135 8,676
HD-183: Lehigh & Northampton Counties 4,674 4,212 1,478 10,364
HD-184: Philadelphia County 8,106 7,596 3,949 19,651
HD-185: Delaware & Philadelphia Counties 9,922 10,429 3,896 24,247
HD-186: Philadelphia County 9,400 11,234 5,008 25,642
HD-187: Lehigh County 3,721 3,120 1,150 7,991
HD-188: Philadelphia County 5,291 8,238 2,705 16,234
HD-189: Monroe & Pike Counties 6,364 6,574 1,860 14,798
HD-190: Philadelphia County 13,793 17,063 7,390 38,246
HD-191: Delaware & Philadelphia Counties 13,147 13,627 5,419 32,193
HD-192: Philadelphia County 11,118 12,608 4,249 27,975
HD-193: Adams & Cumberland Counties 5,158 4,243 1,420 10,821
HD-194: Philadelphia County 2,641 4,422 1,471 8,534
HD-195: Philadelphia County 11,245 12,897 4,448 28,590
HD-196: York County 5,160 4,359 1,255 10,774
HD-197: Philadelphia County 15,676 18,342 7,423 41,441
HD-198: Philadelphia County 13,062 15,213 5,962 34,237
HD-199: Cumberland County 5,891 5,502 2,209 13,602
HD-200: Philadelphia County 6,679 8,587 3,830 19,096
HD-201: Philadelphia County 13,069 14,925 5,969 33,963
HD-202: Philadelphia County 14,653 11,621 4,182 30,456
HD-203: Philadelphia County 12,422 12,269 4,577 29,268

Data as of October 2025

PA Senate District Under 21  Age 21-59  Age 60+  Total
Total 1,234,008 1,242,748 462,390 2,939,146
SD-01: Philadelphia County 18,466 24,621 11,403 54,490
SD-02: Philadelphia County 59,812 62,693 20,930 143,435
SD-03: Philadelphia County 53,815 62,115 24,134 140,064
SD-04: Montgomery & Philadelphia County 28,636 31,931 13,365 73,932
SD-05: Philadelphia County 39,629 36,304 16,496 92,429
SD-06: Bucks County 17,305 14,134 6,798 38,237
SD-07: Montngomery & Philadelphia Counties 34,820 43,600 16,867 95,287
SD-08: Delaware & Philadelphia Counties 42,738 46,970 18,037 107,745
SD-09: Chester & Delaware Counties 21,336 19,062 7,024 47,422
SD-10: Bucks County 16,036 14,851 5,918 36,805
SD-11: Berks County 34,663 28,864 11,661 75,188
SD-12: Montgomery County 15,252 12,465 6,029 33,746
SD-13: Berks & Lancaster Couties 23,019 22,534 7,211 52,764
SD-14: Lehigh & Northampton Counties 34,060 31,258 11,779 77,097
SD-15: Dauphin County 31,988 30,058 9,720 71,766
SD-16: Bucks & Lehigh Counties 15,789 13,477 5,712 34,978
SD-17: Delaware & Montgomery Counties 16,822 13,322 5,229 35,373
SD-18: Lehigh & Northampton Counties 21,354 20,426 8,635 50,415
SD-19: Chester County 14,512 10,826 3,934 29,272
SD-20: Luzerne, Pike, Susquehanna, Wayne, & Wyoming Counties 27,880 28,660 8,661 65,201
SD-21: Butler, Clarion, Erie, Forest, Venango, & Warren Counties 20,909 23,059 8,870 52,838
SD-22: Lackawanna & Luzerne Counties 32,334 33,300 11,682 77,316
SD-23: Bradford, Lycoming, Sullivan, Tioga, & Union Counties 23,588 24,195 9,011 56,794
SD-24: Berks & Montgomery Counties 17,159 14,912 5,033 37,104
SD-25: Cameron, Centre, Clinton, Elk, Jefferson, McKean, & Potter Counties 18,620 20,369 7,328 46,317
SD-26: Delaware County 23,492 21,594 8,462 53,548
SD-27: Columbia, Luzerne, Montour, Northumberland, & Snyder Counties 22,456 23,214 8,997 54,667
SD-28: York County 19,881 17,592 5,256 42,729
SD-29: Carbon, Luzerne, & Schuylkill Counties 33,177 30,352 11,087 74,616
SD-30: Blair, Fulton, Huntingdon, Juniata, & Mifflin Counties 24,265 26,499 9,806 60,570
SD-31: Cumberland & York Counties 29,021 26,364 7,210 62,595
SD-32: Bedford, Fayette, Somerset, & Westmoreland Counties 25,031 29,332 11,853 66,216
SD-33: Adams & Franklin Counties 21,408 18,540 6,047 45,995
SD-34: Cumberland, Dauphin, & Perry Counties 21,160 19,080 7,294 47,534
SD-35: Cambria, Centre, & Clearfield Counties 22,164 25,388 9,445 56,997
SD-36: Lancaster County 18,474 17,104 5,360 40,938
SD-37: Allegheny County 11,613 10,193 3,969 25,775
SD-38: Allegheny County 13,780 14,182 6,060 34,022
SD-39: Westmoreland County 18,426 20,584 7,785 46,795
SD-40: Lackawanna, Monroe, & Wayne Counties 24,178 25,737 8,205 58,120
SD-41: Armstrong, Indiana, Jefferson, & Westmoreland Counties 22,248 25,313 9,519 57,080
SD-42: Allegheny County 22,009 24,435 9,098 55,542
SD-43: Allegheny County 21,220 24,544 9,373 55,137
SD-44: Berks, Chester, & Montgomery Counties 13,695 10,731 4,288 28,714
SD-45: Allegheny County 26,932 27,572 9,367 63,871
SD-46: Beaver, Greene, & Washington Counties 21,587 24,132 8,447 54,166
SD-47: Beaver, Butler, & Lawrence Counties 18,881 18,384 7,035 44,300
SD-48: Berks, Lancaster, & Lebanon Counties 21,208 18,359 6,329 45,896
SD-49: Erie County 31,369 32,136 10,181 73,686
SD-50: Crawford, Lawrence, & Mercer Counties 25,791 27,381 10,450 63,622

Data as of July 2025

Data in table below for this map of PA with the percentage of persons aged 18-64 covered with Medicaid Expansion.
County Medicaid Expansion Count of Enrollees Count of Individuals aged 18-64 Percentage of Persons aged 18-64 covered with Medicaid Expansion (%)
Adams 4,027 61,361 6.56
Allegheny 63,058 754,761 8.35
Armstrong 3,492 36,065 9.68
Beaver 8,397 95,277 8.81
Bedford 2,693 26,771 10.06
Berks 23,027 259,365 8.88
Blair 8,237 69,844 11.79
Bradford 3,025 33,719 8.97
Bucks 22,557 387,972 5.81
Butler 6,306 117,834 5.35
Cambria 8,394 74,741 11.23
Cameron 316 2,375 13.31
Carbon 3,614 37,713 9.58
Centre 4,106 109,459 3.75
Chester 14,010 328,757 4.26
Clarion 1,753 22,496 7.79
Clearfield 4,864 48,035 10.13
Clinton 2,068 22,380 9.24
Columbia 3,130 40,076 7.81
Crawford 4,475 48,051 9.31
Cumberland 10,673 161,395 6.61
Dauphin 18,529 170,474 10.87
Delaware 32,546 353,577 9.2
Elk 1,314 17,718 7.42
Erie 18,289 160,063 11.43
Fayette 9,762 74,602 13.09
Forest 227 4,801 4.73
Franklin 7,249 89,987 8.06
Fulton 771 8,480 9.09
Greene 2,362 21,512 10.98
Huntingdon 2,066 26,566 7.78
Indiana 4,772 50,893 9.38
Jefferson 2,312 24,652 9.38
Juniata 977 13,190 7.41
Lackawanna 15,443 126,475 12.21
Lancaster 25,456 316,678 8.04
Lawrence 5,438 47,048 11.56
Lebanon 6,621 81,076 8.17
Lehigh 23,837 225,845 10.55
Luzerne 24,905 195,398 12.75
Lycoming 6,247 67,092 9.31
McKean 2,356 23,771 9.91
Mercer 6,237 63,325 9.85
Mifflin 2,452 25,915 9.46
Monroe 10,981 104,872 10.47
Montgomery 28,335 514,656 5.51
Montour 679 10,236 6.63
Northampton 13,114 191,267 6.86
Northumberland 5,856 53,038 11.04
Perry 1,864 27,337 6.82
Philadelphia 183,159 1,013,190 18.08
Pike 3,126 35,879 8.71
Potter 904 8,522 10.61
Schuylkill 8,444 85,225 9.91
Snyder 1,508 23,347 6.46
Somerset 3,782 41,804 9.05
Sullivan 246 3,241 7.59
Susquehanna 2,163 21,328 10.14
Tioga 2,406 23,642 10.18
Union 1,330 27,297 4.87
Venango 3,158 27,631 11.43
Warren 2,122 20,799 10.2
Washington 11,483 122,253 9.39
Wayne 2,736 29,018 9.43
Westmoreland 16,523 201,816 8.19
Wyoming 1,535 15,049 10.2
York 23,248 272,637 8.53


The data below represents payment amounts for Medicaid behavioral health services provided to persons eligible because of Medicaid Expansion. Medicaid Expansion, created by Affordable Care Act (ACA), extends health care coverage to low-income, working age adults.  Absent this coverage many individuals would not be able to access these services.

Data as of July 2025

County Distinct recipients who received at least one service Total behavioral health spending
STATE-WIDE TOTALS 219,179 $892,306,959
Adams 1,324 $2,370,512
Allegheny 21,354 $96,489,552
Armstrong 1,462 $4,841,741
Beaver 3,050 $11,342,641
Bedford 921 $2,573,691
Berks 7,389 $28,070,591
Blair 3,545 $14,281,324
Bradford 919 $3,806,735
Bucks 6,492 $38,745,446
Butler 2,429 $10,729,526
Cambria 2,831 $9,196,275
Cameron 139 $300,268
Carbon 1,292 $3,065,068
Centre 1,558 $3,971,239
Chester 3,420 $16,053,444
Clarion 773 $2,823,825
Clearfield 2,247 $7,344,352
Clinton 682 $2,077,777
Columbia 1,058 $3,414,157
Crawford 1,629 $5,621,642
Cumberland 3,241 $12,050,510
Dauphin 6,194 $30,050,386
Delaware 5,672 $29,608,181
Elk 674 $1,847,216
Erie 6,563 $28,084,694
Fayette 3,593 $11,836,886
Forest 67 $142,382
Franklin 2,657 $8,080,777
Fulton 193 $825,657
Greene 896 $3,985,404
Huntingdon 807 $2,103,013
Indiana 1,723 $6,418,681
Jefferson 1,028 $3,059,900
Juniata 319 $772,779
Lackawanna 6,430 $22,559,014
Lancaster 8,077 $37,937,668
Lawrence 2,155 $8,403,652
Lebanon 2,215 $8,604,475
Lehigh 7,036 $29,367,239
Luzerne 7,757 $25,243,101
Lycoming 2,517 $8,087,359
McKean 999 $2,594,956
Mercer 2,248 $8,157,278
Mifflin 1,157 $3,150,505
Monroe 3,162 $9,683,849
Montgomery 6,947 $41,003,208
Montour 218 $705,649
Northampton 4,317 $17,923,182
Northumberland 1,849 $5,574,732
Perry 508 $2,027,823
Philadelphia 33,865 $151,422,117
Pike 980 $2,165,952
Potter 273 $816,243
Schuylkill 3,110 $11,761,076
Snyder 422 $1,441,495
Somerset 1,289 $3,702,428
Sullivan 78 $288,262
Susquehanna 788 $2,261,443
Tioga 818 $2,742,900
Union 380 $817,265
Venango 1,181 $3,757,267
Warren 883 $2,158,356
Washington 3,931 $18,014,426
Wayne 1,019 $3,389,534
Westmoreland 6,219 $24,781,020
Wyoming 599 $1,755,666
York 7,611 $24,021,548

The following data shows the economic impact of the implementation of Medicaid expansion which Pennsylvania implemented in 2015 under the Affordable Care Act (ACA). If the federal government restricted Medicaid expansion, the below data shows the impact it could have on economic stimulus and jobs for a county.

This is  calculated from statewide economic stimulus figure from Rand Health Quarterly / National Library of Medicine.

PA State Total: $4.3 Billion
PA County Avg: $64,385,871

Data as of July 2025

The data below provides the number of persons eligible because of Medicaid Expansion with a substance use disorder (SUD), opioid use disorder (OUD) and serious mental illness by county.  Medicaid Expansion, created by Affordable Care Act (ACA), extends health care coverage to low-income, working age adults

County Number of recipients with a substance use disorder diagnosis (alcohol, opiates, other) Number of recipients with an opioid use disorder diagnosis Number of recipients with a serious mental illness diagnosis
STATE-WIDE TOTALS 62,246 31,073 129,125
Adams 290 126 852
Allegheny 6,655 3,747 12,380
Armstrong 379 161 941
Beaver 894 481 1,879
Bedford 151 81 672
Berks 2,095 854 4,359
Blair 1,261 697 2,024
Bradford 285 80 488
Bucks 2,331 1,370 3,535
Butler 795 469 1,387
Cambria 780 549 1,802
Cameron 30 10 94
Carbon 322 161 851
Centre 294 134 1,086
Chester 1,149 441 1,828
Clarion 178 40 524
Clearfield 654 413 1,397
Clinton 212 70 389
Columbia 241 120 654
Crawford 464 203 1,004
Cumberland 752 368 1,947
Dauphin 2,188 944 2,907
Delaware 2,376 1,154 2,521
Elk 160 90 466
Erie 1,752 805 3,868
Fayette 1,165 774 2,157
Forest 16 <11 40
Franklin 471 214 1,783
Fulton 42 18 128
Greene 324 210 494
Huntingdon 197 94 532
Indiana 443 207 1,118
Jefferson 251 132 651
Juniata 71 32 198
Lackawanna 1,928 832 3,833
Lancaster 2,086 845 4,607
Lawrence 659 495 1,312
Lebanon 657 350 1,215
Lehigh 1,670 679 4,175
Luzerne 2,054 1,093 4,725
Lycoming 883 343 1,343
McKean 180 71 716
Mercer 584 328 1,403
Mifflin 272 127 782
Monroe 661 349 2,094
Montgomery 1,858 970 4,095
Montour 39 18 138
Northampton 991 364 2,680
Northumberland 497 230 1,080
Perry 115 75 321
Philadelphia 9,088 4,541 19,879
Pike 180 71 699
Potter 56 16 179
Schuylkill 892 374 1,840
Snyder 104 45 255
Somerset 380 199 773
Sullivan 16 <11 47
Susquehanna 190 74 512
Tioga 199 57 523
Union 65 33 264
Venango 266 91 776
Warren 157 57 620
Washington 1,307 812 2,294
Wayne 215 111 696
Westmoreland 1,867 1,038 3,735
Wyoming 131 50 403
York 2,331 1,086 4,155

The following data is for persons ages 21 – 64 enrolled in Medicaid and have a disability. The disability status is based upon being in a Medicaid eligibility category which requires documented presence of a disability. There are others in Medicaid who have a disability that are not included in this count.

Data as of July 2025

US House District Recipients
Total 421,637
PA-01: Bucks & Montgomery Counties 12,868
PA-02: Philadelphia County 45,380
PA-03: Philadelphia County 42,741
PA-04: Montgomery & Berks Counties 12,345
PA-05: Delaware, Chester, & Montgomery Counties 22,797
PA-06: Chester & Berks Counties 14,898
PA-07: Carbon, Lehigh, & Northampton Counties: 21,269
PA-08: Wayne, Pike, Lackawannna, Luzerne, & Monroe Counties 26,862
PA-09: Bradford, Columbia, Lebanon, Montour, Northumberland, Schuylkill, Sullivan, Susquehanna, Wyoming, Berks, Luzerne, and Lycoming Counties 25,446
PA-10: Dauphin, Cumberland, and York Counties 22,053
PA-11: Lancaster & York Counties 16,947
PA-12: Allegheny & Westmoreland Counties 24,721
PA-13: Adams, Bedford, Blair, Cambria, Franklin, Fulton, Huntingdon, Juniata, Mifflin, & Perry Counties 26,782
PA-14: Fayette, Greene, Washington, Indiana, Westmoreland, and Somerset Counties 31,691
PA-15: Armstrong, Cameron, Centre, Clarion, Clearfield, Clinton, Elk, Forest, Jefferson, McKean, Potter, Snyder, Tioga, Union, Warren, Indiana, Lycoming, & Venango Counties 27,223
PA-16: Erie, Crawford, Mercer, Lawrence, Butler, & Venango Counties 29,473
PA-17: Beaver & Allegheny Counties 18,141

The following data is for persons ages 21 – 64 enrolled in Medicaid and have a disability. The disability status is based upon being in a Medicaid eligibility category which requires documented presence of a disability. There are others in Medicaid who have a disability that are not included in this count.

Data as of July 2025

PA House District Recipients
Total 421,637
HD-1: Erie County 5,381
HD-2: Erie County 2,775
HD-3: Erie County 1,600
HD-4: Erie County 2,088
HD-5: Berks County 983
HD-6: Crawford & Erie Counties 2,670
HD-7: Mercer County 3,701
HD-8: Butler & Lawrence Counties 1,475
HD-9: Lawrence County 3,149
HD-10: Philadelphia County 4,110
HD-11: Butler County 2,393
HD-12: Butler County 652
HD-13: Chester County 793
HD-14: Beaver County 2,260
HD-15: Beaver & Washington Counties 1,932
HD-16: Beaver County 2,513
HD-17: Butler & Mercer Counties 1,682
HD-18: Bucks County 1,544
HD-19: Allegheny County 3,741
HD-20: Allegheny County 1,305
HD-21: Allegheny County 1,488
HD-22: Lehigh County 3,632
HD-23: Allegheny County 574
HD-24: Allegheny County 2,540
HD-25: Allegheny County: 2,003
HD-26: Chester County 884
HD-27: Allegheny County 1,556
HD-28: Allegheny County 622
HD-29: Bucks County 694
HD-30: Allegheny County 587
HD-31: Bucks County 444
HD-32: Allegheny County 1,897
HD-33: Allegheny County 1,721
HD-34: Allegheny County 2,957
HD-35: Allegheny County 3,666
HD-36: Allegheny County 2,360
HD-37: Lancaster County 1,036
HD-38: Allegheny County 1,886
HD-39: Allegheny & Washington County 1,570
HD-40: Allegheny & Washington County 716
HD-41: Lancaster County 1,840
HD-42: Allegheny County 804
HD-43: Lancaster County 1,205
HD-44: Allegheny County 833
HD-45: Allegheny County 2,317
HD-46: Allegheny & Washington Counties 1,265
HD-47: York County 1,324
HD-48: Washington County 2,644
HD-49: Lancaster County 3,252
HD-50: Green & Washington Counties 3,300
HD-51: Fayette County 4,120
HD-52: Fayette County 3,463
HD-53: Montgomery County 1,186
HD-54: Montgomery County 2,318
HD-55: Westmoreland County 2,238
HD-56: Westmoreland County 1,730
HD-57: Westmoreland County 2,480
HD-58: Westmoreland County 2,526
HD-59: Westmoreland County 2,251
HD-60: Armstrong & Westmoreland Counties 2,353
HD-61: Montgomery County 673
HD-62: Indiana County 2,723
HD-63: Armstrong & Clarion Counties 2,844
HD-64: Crawford & Venango Counties 3,001
HD-65: Crawford, Forest, & Warren Counties 2,239
HD-66: Indiana & Jefferson Counties 3,078
HD-67: Cameron, McKean, & Potter Counties 2,714
HD-68: Bradford & Tioga Counties 2,332
HD-69: Somerset County 2,376
HD-70: Montgomery County 1,130
HD-71: Cambria & Somerset County 2,168
HD-72: Cambria County 3,719
HD-73: Cambria & Clearfield Counties 3,005
HD-74: Chester County 1,710
HD-75: Clearfield & Elk Counties 2,791
HD-76: Clinton & Union Counties 2,433
HD-77: Centre County 894
HD-78: Bedford & Fulton Counties 2,251
HD-79: Blair County 4,060
HD-80: Blair & Huntingdon County 2,088
HD-81: Franklin & Huntingdon Counties 2,280
HD-82: Centre County 774
HD-83: Lycoming & Union Counties 3,176
HD-84: Lycoming & Sullivan Counties 2,208
HD-85: Juniata, Mifflin, Snyder, & Union Counties 1,739
HD-86: Juniata & Perry Counties 1,610
HD-87: Cumberland County 1,062
HD-88: Cumberland County 1,212
HD-89: Franklin County 1,815
HD-90: Franklin County 1,341
HD-91: Adams County 1,312
HD-92: York County 1,266
HD-93: York County 1,099
HD-94: York County 1,399
HD-95: York County 4,109
HD-96: Lancaster County 1,797
HD-97: Lancaster County 1,227
HD-98: Lancaster & Lebanon County 1,194
HD-99: Berks & Lancaster County 906
HD-100: Lancaster County 1,009
HD-101: Lebanon County 2,447
HD-102: Lebanon County 1,098
HD-103: Cumberland & Dauphin Counties 2,526
HD-104: Dauphin County 3,160
HD-105: Dauphin County 1,987
HD-106: Dauphin County 1,143
HD-107: Northumberland & Schuylkill Counties 2,580
HD-108: Montour & Northumberland Counties 2,307
HD-109: Columbia County 1,968
HD-110: Bradford & Wyoming Counties 2,245
HD-111: Susquehanna & Wayne Counties 2,022
HD-112: Lackawanna County 2,290
HD-113: Lackawanna County 3,182
HD-114: Lackawanna County 2,016
HD-115: Monroe County 1,802
HD-116: Luzerne & Schuylkill Counties 2,386
HD-117: Luzerne County 1,613
HD-118: Lackawanna & Luzerne Counties 2,039
HD-119: Luzerne County 2,975
HD-120: Luzerne County 1,798
HD-121: Luzerne County 3,054
HD-122: Carbon County 1,979
HD-123: Schuylkill County 2,903
HD-124: Berks & Schuylkill County 1,515
HD-125: Dauphin County; 1,266
HD-126: Berks County 1,964
HD-127: Berks County 3,730
HD-128: Berks County 947
HD-129: Berks County 2,320
HD-130: Berks County 932
HD-131: Lehigh, Montgomery, and Northampton Counties 904
HD-132: Lehigh County 1,227
HD-133: Lehigh County 1,882
HD-134: Lehigh County 2,581
HD-135: Northampton County 2,539
HD-136: Northampton County 2,039
HD-137: Northampton County 1,050
HD-138: Northampton County 1,199
HD-139: Pike & Wayne Counties 1,711
HD-140: Bucks County 1,398
HD-141: Bucks County 2,344
HD-142: Bucks County 1,130
HD-143: Bucks County 820
HD-144: Bucks County 882
HD-145: Bucks County 1,169
HD-146: Montgomery County 2,121
HD-147: Montgomery County 851
HD-148: Montgomery County 536
HD-149: Montgomery County 831
HD-150: Montgomery County 791
HD-151: Montgomery County 746
HD-152: Montgomery County 1,057
HD-153: Montgomery County 896
HD-154: Montgomery County 1,030
HD-155: Chester County 688
HD-156: Chester County 690
HD-157: Chester County 582
HD-158: Chester County 571
HD-159: Delaware County 3,697
HD-160: Chester & Delaware Counties 486
HD-161: Delaware County 1,481
HD-162: Delaware County 2,219
HD-163: Delaware County 1,913
HD-164: Delaware County 2,475
HD-165: Delaware County 775
HD-166: Delaware County 684
HD-167: Chester County 537
HD-168: Delaware County 646
HD-169: York County 1,149
HD-170: Philadelphia County 1,779
HD-171: Centre & Mifflin Counties 2,422
HD-172: Philadelphia County 1,849
HD-173: Philadelphia County 2,617
HD-174: Philadelphia County 1,943
HD-175: Philadelphia County 1,815
HD-176: Monroe County 1,587
HD-177: Philadelphia County 3,768
HD-178: Bucks County 710
HD-179: Philadelphia County 5,557
HD-180: Philadelphia County 7,168
HD-181: Philadelphia County 4,063
HD-182: Philadelphia County 1,155
HD-183: Lehigh & Northampton Counties 1,536
HD-184: Philadelphia County 2,022
HD-185: Delaware & Philadelphia Counties 3,054
HD-186: Philadelphia County 3,627
HD-187: Lehigh County 831
HD-188: Philadelphia County 2,511
HD-189: Monroe & Pike Counties 1,799
HD-190: Philadelphia County 6,565
HD-191: Delaware & Philadelphia Counties 4,406
HD-192: Philadelphia County 4,141
HD-193: Adams & Cumberland Counties 1,413
HD-194: Philadelphia County 1,192
HD-195: Philadelphia County 4,636
HD-196: York County 1,328
HD-197: Philadelphia County 7,079
HD-198: Philadelphia County 5,225
HD-199: Cumberland County; 1,921
HD-200: Philadelphia County 2,887
HD-201: Philadelphia County 5,128
HD-202: Philadelphia County 2,538
HD-203: Philadelphia County 3,051

The following data is for persons ages 21 – 64 enrolled in Medicaid and have a disability. The disability status is based upon being in a Medicaid eligibility category which requires documented presence of a disability. There are others in Medicaid who have a disability that are not included in this count.

Data as of July 2025

PA Senate District Recipients
Total 421,637
SD-01: Philadelphia County 6,854
SD-02: Philadelphia County 19,778
SD-03: Philadelphia County 21,868
SD-04: Montgomery & Philadelphia County 10,568
SD-05: Philadelphia County 9,277
SD-06: Bucks County 4,484
SD-07: Montngomery & Philadelphia Counties 14,984
SD-08: Delaware & Philadelphia Counties 14,686
SD-09: Chester & Delaware Counties 6,095
SD-10: Bucks County 4,844
SD-11: Berks County 9,024
SD-12: Montgomery County 3,899
SD-13: Berks & Lancaster Couties 7,213
SD-14: Lehigh & Northampton Counties 9,359
SD-15: Dauphin County 8,551
SD-16: Bucks & Lehigh Counties 4,287
SD-17: Delaware & Montgomery Counties 4,323
SD-18: Lehigh & Northampton Counties 7,148
SD-19: Chester County 3,458
SD-20: Luzerne, Pike, Susquehanna, Wayne, & Wyoming Counties 8,980
SD-21: Butler, Clarion, Erie, Forest, Venango, & Warren Counties 9,870
SD-22: Lackawanna & Luzerne Counties 10,548
SD-23: Bradford, Lycoming, Sullivan, Tioga, & Union Counties 9,834
SD-24: Berks & Montgomery Counties 4,697
SD-25: Cameron, Centre, Clinton, Elk, Jefferson, McKean, & Potter Counties 8,749
SD-26: Delaware County 6,332
SD-27: Columbia, Luzerne, Montour, Northumberland, & Snyder Counties 8,392
SD-28: York County 5,016
SD-29: Carbon, Luzerne, & Schuylkill Counties 9,248
SD-30: Blair, Fulton, Huntingdon, Juniata, & Mifflin Counties 11,057
SD-31: Cumberland & York Counties 7,928
SD-32: Bedford, Fayette, Somerset, & Westmoreland Counties 12,265
SD-33: Adams & Franklin Counties 5,756
SD-34: Cumberland, Dauphin, & Perry Counties 6,344
SD-35: Cambria, Centre, & Clearfield Counties 10,737
SD-36: Lancaster County 5,440
SD-37: Allegheny County 3,649
SD-38: Allegheny County 5,070
SD-39: Westmoreland County 8,278
SD-40: Lackawanna, Monroe, & Wayne Counties 7,755
SD-41: Armstrong, Indiana, Jefferson, & Westmoreland Counties 10,884
SD-42: Allegheny County 8,105
SD-43: Allegheny County 8,554
SD-44: Berks, Chester, & Montgomery Counties 3,444
SD-45: Allegheny County 9,230
SD-46: Beaver, Greene, & Washington Counties 8,839
SD-47: Beaver, Butler, & Lawrence Counties 6,949
SD-48: Berks, Lancaster, & Lebanon Counties 5,749
SD-49: Erie County 11,675
SD-50: Crawford, Lawrence, & Mercer Counties 11,563

SNAP

The Supplemental Nutrition Assistance Program (SNAP) is a food assistance program that helps more than 2 million Pennsylvanians – mostly children, older adults, or disabled – buy groceries and feed their household each month.

SNAP benefits are 100% federally funded, and benefits can only be spent on food.

Each month, Pennsylvania receives more than $350 million in SNAP funds from the federal government that support grocers, food retailers, and Pennsylvania’s agricultural industry while also helping individuals and families put food on the table.

While our charitable food network is a vital part of ensuring that Pennsylvanians have access to healthy food, this network cannot replace the benefit to the state from SNAP, which provides 9 meals for every 1 meal provided by our charitable network.

About 1 in 6 Pennsylvanians use SNAP every month
Infographic of people icon showing 35 percent of icons shaded in.

35% percent of SNAP recipients are persons under the age of 18

Infographic of people icon showing 25 percent of icons shaded in.

25% percent of SNAP recipients are 55 years of age or older

Infographic of people icon showing 11 percent of icons shaded in.

11 percent of SNAP recipients ages 18 – 54 have a disability

Due to work requirements implemented in 2016:

Icons of people with 55% in teal color and the other 45% gray.

55% people who lost SNAP Benefits
had  at least 1 chronic medical condition.

Icons of people with 1 teal colored and the other 3 gray.

1 in 4 people who lost SNAP Benefits
had a nutrition-sensitive chronic condition, like diabetes.

SNAP Data

More SNAP data

Data as of October 2025

PA County Individuals receiving SNAP
STATE TOTAL 1,900,894
Adams 8,626
Allegheny 157,784
Armstrong 10,181
Beaver 24,132
Bedford 6,776
Berks 58,879
Blair 22,290
Bradford 8,496
Bucks 45,616
Butler 15,192
Cambria 24,935
Cameron 914
Carbon 9,771
Centre 8,565
Chester 28,483
Clarion 5,105
Clearfield 12,575
Clinton 5,571
Columbia 8,746
Crawford 12,613
Cumberland 25,795
Dauphin 50,486
Delaware 73,164
Elk 3,532
Erie 53,374
Fayette 29,123
Forest 640
Franklin 18,816
Fulton 2,148
Greene 6,729
Huntingdon 5,419
Indiana 11,662
Jefferson 6,530
Juniata 2,522
Lackawanna 40,987
Lancaster 53,728
Lawrence 16,161
Lebanon 18,139
Lehigh 59,694
Luzerne 68,425
Lycoming 17,854
McKean 7,453
Mercer 18,876
Mifflin 7,463
Monroe 22,785
Montgomery 61,522
Montour 1,890
Northampton 34,535
Northumberland 18,136
Perry 4,711
Philadelphia 464,093
Pike 6,678
Potter 2,361
Schuylkill 25,401
Snyder 3,741
Somerset 10,454
Sullivan 558
Susquehanna 5,462
Tioga 6,045
Union 3,361
Venango 9,238
Warren 5,804
Washington 27,045
Wayne 6,462
Westmoreland 44,767
Wyoming 3,800
York 58,075

Data as of October 2025

US House District Number on SNAP under 21 years of age Number on SNAP ages 21 to 59 Number on SNAP 60 and older Total
Total 729,448 781,517 392,338 1,903,303
PA-01: Bucks & Montgomery Counties 18,903 20,508 13,124 52,535
PA-02: Philadelphia County 92,759 94,272 47,605 234,636
PA-03: Philadelphia County 76,757 87,794 43,857 208,408
PA-04: Montgomery & Berks Counties 19,463 19,842 11,397 50,702
PA-05: Delaware, Chester, & Montgomery Counties 46,482 43,347 20,762 110,591
PA-06: Chester & Berks Counties 31,582 26,282 14,066 71,930
PA-07: Carbon, Lehigh, & Northampton Counties: 42,890 41,472 21,185 105,547
PA-08: Wayne, Pike, Lackawannna, Luzerne, & Monroe Counties 56,073 57,051 26,325 139,449
PA-09: Bradford, Columbia, Lebanon, Montour, Northumberland, Schuylkill, Sullivan, Susquehanna, Wyoming, Berks, Luzerne, and Lycoming Counties 43,214 47,493 22,738 113,445
PA-10: Dauphin, Cumberland, and York Counties 46,870 45,483 20,164 112,517
PA-11: Lancaster & York Counties 28,788 29,704 13,850 72,342
PA-12: Allegheny & Westmoreland Counties 43,187 46,746 25,242 115,175
PA-13: Adams, Bedford, Blair, Cambria, Franklin, Fulton, Huntingdon, Juniata, Mifflin, & Perry Counties 39,411 44,349 22,632 106,392
PA-14: Fayette, Greene, Washington, Indiana, Westmoreland, and Somerset Counties 40,119 53,550 27,720 121,389
PA-15: Armstrong, Cameron, Centre, Clarion, Clearfield, Clinton, Elk, Forest, Jefferson, McKean, Potter, Snyder, Tioga, Union, Warren, Indiana, Lycoming, & Venango Counties 31,527 40,930 21,123 93,580
PA-16: Erie, Crawford, Mercer, Lawrence, Butler, & Venango Counties 44,888 52,099 23,627 120,614
PA-17: Beaver & Allegheny Counties 26,535 30,595 16,921 74,051

Data as of October 2025

PA House District Under 21  Age 21-59  Age 60+  Total
Total 729,448 781,517 392,338 1,903,303
HD-1: Erie County 9,641 11,007 3,902 24,550
HD-2: Erie County 5,614 5,291 2,116 13,021
HD-3: Erie County 2,263 2,668 1,350 6,281
HD-4: Erie County 3,606 3,923 1,665 9,194
HD-5: Berks County 1,518 1,700 846 4,064
HD-6: Crawford & Erie Counties 3,234 3,997 2,192 9,423
HD-7: Mercer County 5,388 6,227 2,709 14,324
HD-8: Butler & Lawrence Counties 1,866 2,425 1,486 5,777
HD-9: Lawrence County 4,765 6,044 2,704 13,513
HD-10: Philadelphia County 7,474 8,728 4,384 20,586
HD-11: Butler County 2,693 3,663 1,870 8,226
HD-12: Butler County 818 869 565 2,252
HD-13: Chester County 1,890 1,300 864 4,054
HD-14: Beaver County 3,385 3,837 1,960 9,182
HD-15: Beaver & Washington Counties 2,650 3,178 1,794 7,622
HD-16: Beaver County 4,229 4,890 2,283 11,402
HD-17: Butler & Mercer Counties 2,298 2,795 1,426 6,519
HD-18: Bucks County 2,857 2,846 2,271 7,974
HD-19: Allegheny County 6,817 7,403 3,738 17,958
HD-20: Allegheny County 1,837 2,246 1,391 5,474
HD-21: Allegheny County 1,576 2,417 1,607 5,600
HD-22: Lehigh County 9,498 8,389 3,571 21,458
HD-23: Allegheny County 692 943 791 2,426
HD-24: Allegheny County 4,702 4,968 3,049 12,719
HD-25: Allegheny County 4,066 3,913 1,837 9,816
HD-26: Chester County 1,608 1,328 894 3,830
HD-27: Allegheny County 3,006 3,019 1,674 7,699
HD-28: Allegheny County 568 723 429 1,720
HD-29: Bucks County 427 687 589 1,703
HD-30: Allegheny County 488 635 397 1,520
HD-31: Bucks County 355 512 444 1,311
HD-32: Allegheny County 3,370 3,560 1,913 8,843
HD-33: Allegheny County 2,462 2,829 1,737 7,028
HD-34: Allegheny County 4,812 5,600 2,941 13,353
HD-35: Allegheny County 7,384 7,422 3,700 18,506
HD-36: Allegheny County 4,209 4,685 2,279 11,173
HD-37: Lancaster County 1,356 1,448 762 3,566
HD-38: Allegheny County 3,254 3,549 1,851 8,654
HD-39: Allegheny & Washington Counties 2,232 2,621 1,589 6,442
HD-40: Allegheny & Washington Counties 781 875 658 2,314
HD-41: Lancaster County 2,942 2,954 1,504 7,400
HD-42: Allegheny County 1,073 1,235 800 3,108
HD-43: Lancaster County 1,877 1,884 938 4,699
HD-44: Allegheny County 1,387 1,375 729 3,491
HD-45: Allegheny County 3,326 3,796 2,132 9,254
HD-46: Allegheny & Washington Counties 1,848 2,111 1,141 5,100
HD-47: York County 2,504 2,482 1,078 6,064
HD-48: Washington County 3,396 4,656 2,186 10,238
HD-49: Lancaster County 6,334 6,326 2,736 15,396
HD-50: Green & Washington Counties 4,593 6,148 2,647 13,388
HD-51: Fayette County 4,922 6,950 3,472 15,344
HD-52: Fayette County 4,512 5,803 3,104 13,419
HD-53: Montgomery County 2,307 2,088 1,530 5,925
HD-54: Montgomery County 5,951 4,289 1,861 12,101
HD-55: Westmoreland County 3,198 3,937 2,133 9,268
HD-56: Westmoreland County 2,156 2,756 1,553 6,465
HD-57: Westmoreland County 2,777 4,031 1,994 8,802
HD-58: Westmoreland County 3,364 4,413 2,356 10,133
HD-59: Westmoreland County 2,522 3,408 2,094 8,024
HD-60: Armstrong & Westmoreland Counties 3,222 4,040 2,176 9,438
HD-61: Montgomery County 772 914 909 2,595
HD-62: Indiana County 2,929 4,163 2,046 9,138
HD-63: Armstrong & Clarion Counties 3,070 4,056 2,281 9,407
HD-64: Crawford & Venango Counties 4,141 5,088 2,432 11,661
HD-65: Crawford, Forest, & Warren Counties 2,725 3,602 1,884 8,211
HD-66: Indiana & Jefferson Counties 3,048 3,926 2,151 9,125
HD-67: Cameron, McKean, & Potter Counties 3,772 4,770 2,139 10,681
HD-68: Bradford & Tioga Counties 3,416 3,975 2,003 9,394
HD-69: Somerset County 2,976 4,011 2,424 9,411
HD-70: Montgomery County 1,346 1,465 980 3,791
HD-71: Cambria & Somerset Counties 2,782 3,382 1,993 8,157
HD-72: Cambria County 5,811 6,394 3,063 15,268
HD-73: Cambria & Clearfield Counties 3,248 4,390 2,487 10,125
HD-74: Chester County 4,509 3,513 1,566 9,588
HD-75: Clearfield & Elk Counties 2,629 3,648 1,843 8,120
HD-76: Clinton & Union Counties 2,699 3,371 1,853 7,923
HD-77: Centre County 957 1,630 637 3,224
HD-78: Bedford & Fulton Counties 3,029 3,513 2,217 8,759
HD-79: Blair County 5,137 6,514 2,707 14,358
HD-80: Blair & Huntingdon Counties 2,791 3,298 1,763 7,852
HD-81: Franklin & Huntingdon Counties 2,832 3,311 1,813 7,956
HD-82: Centre County 915 1,172 696 2,783
HD-83: Lycoming & Union Counties 4,651 5,153 2,076 11,880
HD-84: Lycoming & Sullivan Counties 2,461 2,851 1,679 6,991
HD-85: Juniata, Mifflin, Snyder, & Union Counties 2,397 2,628 1,424 6,449
HD-86: Juniata & Perry Counties 2,588 2,809 1,481 6,878
HD-87: Cumberland County 1,714 1,742 1,031 4,487
HD-88: Cumberland County 2,362 2,213 1,228 5,803
HD-89: Franklin County 3,812 3,733 1,714 9,259
HD-90: Franklin County 2,826 2,847 1,284 6,957
HD-91: Adams County 2,146 2,100 1,176 5,422
HD-92: York County 2,308 2,336 1,114 5,758
HD-93: York County 2,048 2,025 1,009 5,082
HD-94: York County 2,650 2,571 1,100 6,321
HD-95: York County 9,920 9,883 3,354 23,157
HD-96: Lancaster County 2,652 3,361 1,637 7,650
HD-97: Lancaster County 1,712 1,761 821 4,294
HD-98: Lancaster & Lebanon Counties 1,674 1,967 956 4,597
HD-99: Berks & Lancaster Counties 1,401 1,334 727 3,462
HD-100: Lancaster County 1,637 1,591 795 4,023
HD-101: Lebanon County 5,318 4,949 2,330 12,597
HD-102: Lebanon County 2,034 2,012 1,044 5,090
HD-103: Cumberland & Dauphin Counties 5,937 6,186 2,560 14,683
HD-104: Dauphin County 8,509 7,241 2,958 18,708
HD-105: Dauphin County 4,014 3,898 1,865 9,777
HD-106: Dauphin County 2,005 2,024 1,219 5,248
HD-107: Northumberland & Schuylkill Counties 4,749 5,378 2,444 12,571
HD-108: Montour & Northumberland Counties 3,565 4,146 2,020 9,731
HD-109: Columbia County 3,000 3,472 1,936 8,408
HD-110: Bradford & Wyoming Counties 3,339 4,021 1,817 9,177
HD-111: Susquehanna & Wayne Counties 3,267 3,763 1,841 8,871
HD-112: Lackawanna County 3,973 4,577 2,070 10,620
HD-113: Lackawanna County 6,157 6,252 3,101 15,510
HD-114: Lackawanna County 4,028 4,183 1,948 10,159
HD-115: Monroe County 3,812 3,921 1,767 9,500
HD-116: Luzerne & Schuylkill Counties 8,894 6,255 3,091 18,240
HD-117: Luzerne County 2,674 3,143 1,686 7,503
HD-118: Lackawanna & Luzerne Counties 3,573 4,010 2,122 9,705
HD-119: Luzerne County 6,674 6,772 2,429 15,875
HD-120: Luzerne County 3,500 3,764 1,790 9,054
HD-121: Luzerne County 7,613 7,581 2,955 18,149
HD-122: Carbon County 3,773 3,810 1,846 9,429
HD-123: Schuylkill County 4,830 6,042 2,645 13,517
HD-124: Berks & Schuylkill County 2,812 2,905 1,524 7,241
HD-125: Dauphin County 2,292 2,336 1,284 5,912
HD-126: Berks County 5,353 4,036 1,945 11,334
HD-127: Berks County 8,804 7,307 3,744 19,855
HD-128: Berks County 1,365 1,447 749 3,561
HD-129: Berks County 5,298 4,677 2,431 12,406
HD-130: Berks County 1,394 1,518 889 3,801
HD-131: Lehigh, Montgomery, & Northampton Counties 1,308 1,389 722 3,419
HD-132: Lehigh County 2,529 2,287 1,553 6,369
HD-133: Lehigh County 3,976 3,664 2,210 9,850
HD-134: Lehigh County 6,370 5,621 2,727 14,718
HD-135: Northampton County 4,496 4,509 2,330 11,335
HD-136: Northampton County 3,801 4,100 2,066 9,967
HD-137: Northampton County 1,418 1,538 861 3,817
HD-138: Northampton County 1,995 2,225 1,171 5,391
HD-139: Pike & Wayne Counties 2,442 2,981 1,642 7,065
HD-140: Bucks County 2,477 2,639 1,332 6,448
HD-141: Bucks County 3,911 4,565 2,034 10,510
HD-142: Bucks County 1,527 1,699 1,025 4,251
HD-143: Bucks County 1,087 1,145 693 2,925
HD-144: Bucks County 1,473 1,344 950 3,767
HD-145: Bucks County 1,410 1,565 1,012 3,987
HD-146: Montgomery County 4,313 4,136 1,582 10,031
HD-147: Montgomery County 1,209 1,273 767 3,249
HD-148: Montgomery County 505 601 449 1,555
HD-149: Montgomery County 1,351 1,365 748 3,464
HD-150: Montgomery County 1,031 1,086 612 2,729
HD-151: Montgomery County 996 1,044 785 2,825
HD-152: Montgomery County 1,619 1,693 1,223 4,535
HD-153: Montgomery County 1,233 1,341 888 3,462
HD-154: Montgomery County 1,517 1,626 927 4,070
HD-155: Chester County 894 936 504 2,334
HD-156: Chester County 1,003 904 542 2,449
HD-157: Chester County 366 468 472 1,306
HD-158: Chester County 1,180 814 509 2,503
HD-159: Delaware County 8,404 8,007 3,249 19,660
HD-160: Chester & Delaware Counties 370 459 328 1,157
HD-161: Delaware County 2,715 2,669 1,256 6,640
HD-162: Delaware County 4,042 3,859 1,736 9,637
HD-163: Delaware County 4,065 3,918 1,651 9,634
HD-164: Delaware County 5,954 5,072 2,656 13,682
HD-165: Delaware County 685 854 586 2,125
HD-166: Delaware County 623 726 616 1,965
HD-167: Chester County 677 626 358 1,661
HD-168: Delaware County 376 508 362 1,246
HD-169: York County 2,616 2,542 1,075 6,233
HD-170: Philadelphia County 4,264 3,835 3,073 11,172
HD-171: Centre & Mifflin Counties 2,814 3,756 1,906 8,476
HD-172: Philadelphia County 4,984 4,107 3,178 12,269
HD-173: Philadelphia County 6,312 5,479 2,456 14,247
HD-174: Philadelphia County 5,293 4,577 3,504 13,374
HD-175: Philadelphia County 1,037 3,024 2,361 6,422
HD-176: Monroe County 2,416 2,909 1,568 6,893
HD-177: Philadelphia County 7,795 8,113 3,210 19,118
HD-178: Bucks County 732 878 699 2,309
HD-179: Philadelphia County 10,991 11,244 4,460 26,695
HD-180: Philadelphia County 12,947 14,295 5,452 32,694
HD-181: Philadelphia County 6,998 8,460 4,124 19,582
HD-182: Philadelphia County 869 2,689 1,839 5,397
HD-183: Lehigh & Northampton Counties 2,358 2,475 1,346 6,179
HD-184: Philadelphia County 5,043 4,284 3,310 12,637
HD-185: Delaware & Philadelphia Counties 6,409 6,635 3,362 16,406
HD-186: Philadelphia County 6,806 7,697 4,327 18,830
HD-187: Lehigh County 1,540 1,569 805 3,914
HD-188: Philadelphia County 3,737 5,554 2,234 11,525
HD-189: Monroe & Pike Counties 3,609 3,945 1,707 9,261
HD-190: Philadelphia County 10,809 12,455 6,380 29,644
HD-191: Delaware & Philadelphia Counties 9,389 9,509 4,356 23,254
HD-192: Philadelphia County 8,128 8,920 3,885 20,933
HD-193: Adams & Cumberland Counties 2,486 2,323 1,296 6,105
HD-194: Philadelphia County 1,331 2,197 1,083 4,611
HD-195: Philadelphia County 9,095 9,407 3,930 22,432
HD-196: York County 2,548 2,488 1,096 6,132
HD-197: Philadelphia County 11,925 12,971 6,523 31,419
HD-198: Philadelphia County 9,468 10,464 4,931 24,863
HD-199: Cumberland County 3,295 3,258 1,594 8,147
HD-200: Philadelphia County 4,220 5,411 3,071 12,702
HD-201: Philadelphia County 9,625 10,371 5,087 25,083
HD-202: Philadelphia County 9,264 6,556 3,284 19,104
HD-203: Philadelphia County 7,998 7,385 3,757 19,140

Data as of October 2025

PA Senate District Under 21  Age 21-59  Age 60+  Total
Total 729,448 781,517 392,338 1,903,303
SD-01: Philadelphia County 10,017 14,053 9,654 33,724
SD-02: Philadelphia County 42,118 41,449 17,669 101,236
SD-03: Philadelphia County 40,903 43,609 20,817 105,329
SD-04: Montgomery & Philadelphia County 17,946 20,162 10,418 48,526
SD-05: Philadelphia County 23,429 20,385 13,044 56,858
SD-06: Bucks County 6,970 7,196 5,121 19,287
SD-07: Montngomery & Philadelphia Counties 25,372 30,028 14,416 69,816
SD-08: Delaware & Philadelphia Counties 29,603 31,670 15,175 76,448
SD-09: Chester & Delaware Counties 12,241 11,372 4,995 28,608
SD-10: Bucks County 7,028 8,210 4,377 19,615
SD-11: Berks County 21,167 17,711 9,056 47,934
SD-12: Montgomery County 5,678 5,713 4,245 15,636
SD-13: Berks & Lancaster Couties 12,294 12,701 6,002 30,997
SD-14: Lehigh & Northampton Counties 21,668 19,714 9,474 50,856
SD-15: Dauphin County 19,827 18,769 8,489 47,085
SD-16: Bucks & Lehigh Counties 6,714 6,820 4,174 17,708
SD-17: Delaware & Montgomery Counties 8,496 7,074 3,553 19,123
SD-18: Lehigh & Northampton Counties 12,502 13,035 6,909 32,446
SD-19: Chester County 6,726 5,416 3,097 15,239
SD-20: Luzerne, Pike, Susquehanna, Wayne, & Wyoming Counties 17,052 18,735 8,174 43,961
SD-21: Butler, Clarion, Erie, Forest, Venango, & Warren Counties 11,793 15,569 7,792 35,154
SD-22: Lackawanna & Luzerne Counties 21,797 22,551 10,390 54,738
SD-23: Bradford, Lycoming, Sullivan, Tioga, & Union Counties 13,472 15,341 7,385 36,198
SD-24: Berks & Montgomery Counties 7,915 7,990 4,179 20,084
SD-25: Cameron, Centre, Clinton, Elk, Jefferson, McKean, & Potter Counties 10,066 13,108 6,341 29,515
SD-26: Delaware County 11,864 11,405 6,030 29,299
SD-27: Columbia, Luzerne, Montour, Northumberland, & Snyder Counties 13,457 15,401 7,699 36,557
SD-28: York County 10,063 9,897 4,258 24,218
SD-29: Carbon, Luzerne, & Schuylkill Counties 21,311 20,059 9,638 51,008
SD-30: Blair, Fulton, Huntingdon, Juniata, & Mifflin Counties 14,017 17,314 8,570 39,901
SD-31: Cumberland & York Counties 17,002 16,784 6,725 40,511
SD-32: Bedford, Fayette, Somerset, & Westmoreland Counties 15,480 20,350 11,302 47,132
SD-33: Adams & Franklin Counties 11,082 10,926 5,328 27,336
SD-34: Cumberland, Dauphin, & Perry Counties 10,904 10,973 5,787 27,664
SD-35: Cambria, Centre, & Clearfield Counties 13,545 16,808 8,831 39,184
SD-36: Lancaster County 8,075 8,773 4,138 20,986
SD-37: Allegheny County 4,330 4,902 3,271 12,503
SD-38: Allegheny County 6,974 8,213 5,245 20,432
SD-39: Westmoreland County 9,721 13,314 7,437 30,472
SD-40: Lackawanna, Monroe, & Wayne Counties 13,756 15,511 7,354 36,621
SD-41: Armstrong, Indiana, Jefferson, & Westmoreland Counties 13,321 17,168 9,139 39,628
SD-42: Allegheny County 13,717 15,508 8,411 37,636
SD-43: Allegheny County 14,821 16,237 8,783 39,841
SD-44: Berks, Chester, & Montgomery Counties 5,442 5,095 2,897 13,434
SD-45: Allegheny County 17,748 18,187 9,036 44,971
SD-46: Beaver, Greene, & Washington Counties 11,926 15,662 7,574 35,162
SD-47: Beaver, Butler, & Lawrence Counties 10,486 12,052 6,240 28,778
SD-48: Berks, Lancaster, & Lebanon Counties 10,606 10,477 5,313 26,396
SD-49: Erie County 20,809 22,586 9,022 52,417
SD-50: Crawford, Lawrence, & Mercer Counties 16,197 19,534 9,364 45,095

SNAP benefits have a profound impact on the Commonwealth’s economy.

In December 2024, SNAP brought $366,850,460 in federally funded food assistance benefits to our communities. See how much SNAP brings in for each county:

Snap Economic Impact Map Adams	$1,442,551  Allegheny	$31,122,833  Armstrong	$1,751,766  Beaver	$4,516,789  Bedford	$1,097,046  Berks	$11,316,416  Blair	$3,974,804  Bradford	$1,401,889  Bucks	$8,864,989  Butler	$2,725,917  Cambria	$4,383,274  Cameron	$141,829  Carbon	$1,719,049  Centre	$1,544,855  Chester	$5,542,385  Chester	$850,542  Clarion	$2,080,602  Clearfield	$967,066  Clinton	$1,494,057  Columbia	$2,197,997  Crawford	$4,644,125  Cumberland	$10,160,082  Dauphin	$15,012,141  Delaware	$609,759  Elk	$10,031,126  Erie	$5,312,135  Fayette	$86,564  Forest	$3,350,290  Franklin	$356,856  Fulton	$1,258,088  Greene	$865,452  Huntingdon	$1,966,749  Indiana	$1,001,528  Jefferson	$414,492  Juniata	$7,666,080  Lackawanna	$10,301,706  Lancaster	$2,926,564  Lawrence	$3,162,329  Lebanon	$11,446,527  Lehigh	$12,836,599  Luzerne	$3,182,460  Lycoming	$1,303,870  McKean	$3,452,017  Mercer	$1,212,073  Mifflin	$4,325,751  Monroe	$12,513,857  Montgomery	$303,534  Montour	$6,307,791  Northampton	$3,095,814  Northumberland	$770,607  Perry	$98,659,841  Philadelphia	$1,161,841  Pike	$381,040  Potter	$4,437,493  Schuylkill	$577,744  Snyder	$1,663,189  Somerset	$102,478  Sullivan	$893,891  Susquehanna	$1,013,737  Tioga	$524,038  Union	$1,645,205  Venango	$987,032  Warren	$5,102,452  Washington	$1,075,462  Wayne	$7,930,131  Westmoreland	$677,005  Wyoming	$11,004,259  York

Data as of December 2024

The United States Department of Agriculture’s Economic Research Center found that
for every $1 issued in federal SNAP benefits,
it helps grow our economy by $1.54
through job retention and creation and income for farms and other agricultural producers. This program is an important part of supporting a healthy economy for all Pennsylvanians in every county of our Commonwealth. 

View data & learn more about DHS programs

Enrollment Information

Data By Topic

Child Welfare

Providing open data around child welfare helps keep Pennsylvania's children safer. An interactive dashboard around child welfare services is planned for a future release.

County Block Grant Funds

Annually, counties submit County Human Services Plans to DHS for approval. Funds included in this plan are a small but significant portion of the total funds allocated to counties for the delivery of human services. Thirty-eight counties have opted in to receive block grant funding via a pilot program, providing for the county-based human service needs of their residents.

Early Childhood Education

The Office of Child Development and Early Learning (OCDEL) has a research page where Pennsylvanians can review needs assessments, program information, and public data. Browse the data dashboards (please note that data maps will take some time to load).

Developmental Programs

Long-Term Care

This workbook from the Office of Long-Term Living provides information about nursing facilities, such as demographics, cost, and how many residents within each facility receive Medical Assistance.

Medicaid

  • The HealthChoices website hosts data books and provides historical data about the HealthChoices program in Pennsylvania.
  • Medicaid data dashboard — View our interactive data and see how many Pennsylvanians were able to get covered and get connected to critical health care services.

Mental Health

DHS is committed to improving the mental health and substance abuse programs it provides to all Pennsylvanians.

Office of Long Term Living (OLTL)

OLTL's Data Dash is a collection of documents regarding current OLTL enrollment data, market share between CHC-MCO's and other frequently requested information.

Personal Care Homes

Check out the number of licensed personal care homes in the state, information about residents, how many beds are available, and more.

Human Services County Data

In an effort to track outcomes, here are two interactive dashboards that capture county data around mental health and substance abuse programs, and home and community-based service programs for people with intellectual disabilities.